
Tis The Season Of Clichés
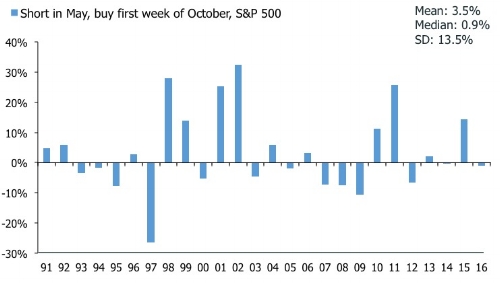
Google informs me that the advice to "sell in May, and go away" comes from the tradition of British merchant bankers—I presume in the 19th century—to leave London for the country side in May and come back on St Leger's Day in September. I am partial to a good anecdote, but does it work? In order to check, I ran a little study using the S&P 500 going back to 1991. The first chart below shows the returns you would have foregone by selling in May and waiting 35 weeks and 17 weeks, respectively, before buying back. I have included both mean and median returns, because the outliers can skew the former when your sample size is not large. The second chart shows the results of a strategy which shorts the S&P 500 in May, buys the first week of October, and holds until year end.
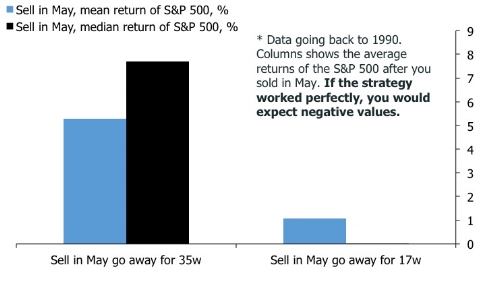
Selling in May and waiting until the end of the year to buy back clearly is a bad strategy. On average you would have watched the market run away with 5.3%, with an even higher median of 7.7%. If on the other hand you bought back after 17 weeks, the results are pretty much a wash; you wouldn't have lost much ground. In order to evaluate whether this is a smart strategy, though, we need consider volatility and drawdowns in the period where we weren't in the market. If, for example, the market tended to produce higher volatility and larger drawdowns over the summer, it would probably be a good strategy to hold a little bit of extra cash over that period. In addition, we should also check whether the performance after May is conditional on the performance in the first part of the year. Needless to say, I haven't had time to check all these factors.
The strategy depicted in the second chart above, however, tries to approximate this question. And suddenly the results are slightly better. On average, shorting in May and getting long in the first week of October have produced a return of 3.5%, although the median is a more modest 0.9%. In addition, the standard deviation of 13.5% suggests that the Sharpe ratio of this strategy is not that good. On average, you might do o.k. with this strategy, but in the years where it goes wrong you get rodgered.
So, what's the conclusion?
Based on the analysis above, I would argue that it probably isn't worth it to bet the farm on the idea of selling in May. Sometimes it works, sometimes it doesn't. In case you think my analysis is tripe, though, I am happy to announce that Bloomberg's trusty macro geek Cameron Crise also had a look at the "sell in May go away" meme. His methodology, I am happy to admit, is geekier and more intricate than mine. But the upshot is that his little study supports my second chart above, to some extent at least. Mr. Crise cautions that investors probably should step back in the short run, but also that they should step back in before the year is over. With some ruthless chopping of the note, the following summarises the message from Cameron's analysis.
"The results suggest caution for U.S. equity investors next month, with a forecast return of -1.3%. Since 1991, there have been seven prior negative forecasts for May. The average return of those months has been -1.29% with a median of -0.91%. Four of the seven delivered negative returns. (...) What about for the entirety of the May-October period? The model is more sanguine, forecasting a return of 3.96%. "
Whether investors choose to sell in May is, of course, their own choice. Based on this analysis, however, those who do may not wish to stay away the whole summer."
So there you have it. Could this be a year when selling in May, and buying back in October is a winner?
To Reflate Or Not To Reflate?
I sympathize with portfolio and asset managers who currently feel frustrated. For many, every fiber in their bodies are telling them that they should reduce exposure to risk assets, but they also realize that this impulse has been a costly one in this bull market. Last week's grand tax reform plan from Mr. Trump and his team crystallized this conundrum. If passed as presented it could provide a meaningful short-term boost to the economy and the financial market reflation narrative, but chances are high that it will be a dud. Earlier this year, I mused about possible economic scenarios during Mr. Trump's presidency. They're still relevant I think.
1) Raging USD bull, higher global growth. In this scenario, Mr. Trump's policy mix emphasizes domestic fiscal stimulus, but a relatively benign clampdown on free trade if any at all. The Fed raises rates, but the U.S. economy continues to power ahead by sucking in savings from abroad. The USD appreciates, the U.S. c/a deficit widens, and we all live happily ever after, at least for a while.
2) Stronger USD offsets aggressive border adjustment tax. In this scenario, the border tax adjustment happens, but a stronger dollar offsets the impact on the U.S. trade deficit. The key changes in this scenario would be within the U.S. economy and the economies of its closest trading partners.
3) Weaker USD with an aggressive border adjustment tax. In this scenario, Mr. Trump goes full bore on the border adjustment tax/free trade clampdown. The USD dollar depreciates because markets perceive it to be adverse to U.S. economic growth. Domestic inflation rises sharply, the U.S. economy slows and the trade deficit narrows. The rest of the world is pulled down with the U.S. economy and a global recession ensues.
We can talk about stock market valuations, credit spreads, and where we are in the business cycle until the cows come home. But markets often trade on what is in front of them, and speculation over economic policies in the U.S—and the link between fiscal and monetary policy decisions—remains a key pivot for risk assets. In that context, the tax plan presented by Mr. Trump is "bullish", at least in spirit. In essence, it pushes us closer to option number 1 above. In classic Trump fashion the tax plan appears to include all the popular proposals, mainly in the form of significant tax cuts. But the border adjustment tax—supposed to be a key component to finance tax cuts as part of a larger domestic tax reform in the U.S.—has been left out. After all, the BAT is complicated and unpopular among many U.S. industries with powerful lobbies in Washington. Instead, the U.S. administration had deferred to one of the oldest tricks in the macroeconomic policy book; they're arguing that the tax cuts will pay for themselves via higher growth. This type of naive Laffer curve economics is unlikely to go down well in Congress, and we have to assume that it won't pass in the form that it was presented last week.
Markets, however, still prefer to believe that Mr. Trump will find a way to deliver that elusive +3% GDP growth, and the balance of the tax proposal provides support for the bulls. If Mr. Trump wants growth via tax cuts, but can't figure out how to finance that via a "revenue neutral" tax reform, he only has to look abroad. The Eurozone, Japan and emerging markets have plenty of excess savings ready to keep U.S. yield relatively low as the economy lets rip. Of course, that would mean a significantly wider U.S. current account deficit which brings us full circle on three scenarios above.
Surprised that surprises are rolling over?
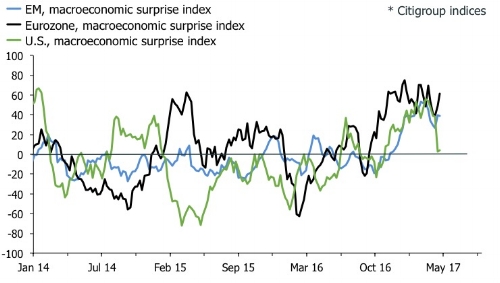
More generally in markets, one of the more interesting developments last week was that the U.S. macroeconomic surprise index finally gave up the ghost. Survey data have been soaring recently, but hard data have trailed. The advance Q1 GDP print confirmed the bad news, showing that the economy slowed significantly at the start of the year.
This headline is worrying, but it is fairly easy for the market to look through it given the regularity with which U.S. GDP growth has plunged in Q1 only to rebound strongly later in the year since the financial crisis. My boss, and U.S. economics geek Ian Shepherdson, reckons this persistent seasonal "misjudgement" is worth a full 1 percentage points of GDP. In addition, the Q1 number was plagued by a number of specific headwinds; consumer spending was hit by a delay in tax refunds and warm weather, which depressed spending on utilities. Headline leading indicators are turning up, indicating that headline GDP growth will rebound. That said, the GDP headline doesn't play well with the reflation-narrative, and equity bulls buying the idea of a breakout in U.S. GDP better hope the data picks up soon. The GDP data also will worry those who believe the Fed will hike several times this year, but not much. Assuming the labor market data remains firm, the Fed is likely to stay on course, not least based on signs that fiscal policy is about to become much looser.
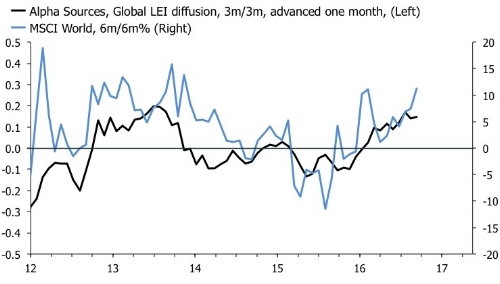
In the Eurozone and emerging markets macroeconomic surprises remain high, but they tend to mean-revert and I think investors have to assume that this trend is about to repeat itself over the next few months. The second chart below supports this argument by showing that momentum of the MSCI World has run ahead of the rise in my diffusion index of leading indicators. All this should mean weaker risk assets across the board, but this is far from certain. Markets love to rally on good news in the economy, and bad news only means an even slower path towards Fed normalization, not to mention a lower probability of the ECB and the BOJ pulling back from QE/ZIRP. The latter, of course, eventually provides support for credit spreads and equities, preventing markets from falling too fast too far.
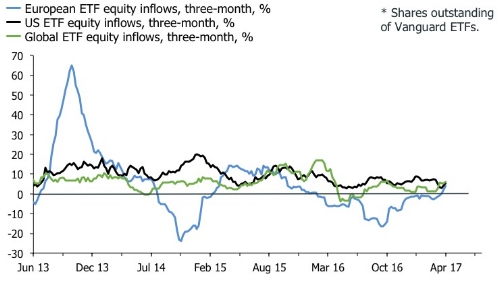
Investors also have to respect the idea of divergence between headline country/region indices and sectors. European equities, for example, have been in a strong and stable uptrend since the beginning of the year. And they are showing few signs of rolling over. I have warned that equity markets in the euro area are not cheap, but you can't argue with flows. The chart below shows that European equity inflows—measured with Vanguard's ETFs—have just recently turned positive on a three-month basis following a long period of outflows. This would suggest that the rally in Europe will continue.
The bullish trend was boosted last week following Mr. Macron's victory in the first round of the French presidential elections. Whatever reservations you might have about absolute European equity valuations, it's clear that the combination of relative attractiveness compared with the U.S. and the hope of a European reflation story currently are strong catalysts. This is especially the case because it could lift EZ financials, and if they have to "catch up" in full from their post-crisis underperformance the benchmark index will fly.
Amid all the confusion, the key trend for me remains that the U.S. curve is flattening. I have persistently been making this point in the last few weeks, because it provides an important cautionary tale not to chase the reflation narrative too hard. In other words, if you can show me a world in which the Fed raises rates and the U.S. curve steepens, I will be forced to change my views on the reflation narrative. So far, though, that is not happening. The chart below shows the U.S. 2s5s, which has rolled over recently and my base case remains that if the Fed has to punch it, this spread will flatten significantly given where we are in the business cycle.

Portfolio notes
I have made a few minor adjustments in the portfolio recently and will update the tables soon. I have sold the position in Easyjet for a nice profit and added to a few of the other core positions. Earnings have been a mixed bag. Punters pushed up Syntel into the announcement and dumped it following weak guidance. It does appear that most of the bad news is priced in here, but price action remains volatile and directionless. I am a carrying a loss here and probably should have sold last month to get the tax relief, but I didn't, so I have averaged down very slightly.
Analyst downgrades hit Vectura, but my experience suggest these events usually are buying opportunities so I have added a bit. I have also added slightly to the soft commodity ETF to keep its weight in the portfolio constant. In the EM department, markets appear excited about the LatAm retailer Falabella, but not so much Cencosud, which suggests that I am on the wrong horse here. Elsewhere, though, I am noting a lot of bullish talk about Colombia among EM specialists. If followed up with action, it would benefit the position in CIB, Bancolombia, which is the biggest constituency in the main ETF GXG. The main good news in the last month came from the announcement that the small U.K. manufacturer of water desalination and membrane technology has entered the Chinese market. Modern Water secured the sale of technology to Hangzhou Water Treatment Technology Development Center Co, and also, as far as I can see, managed to lock in a post-sale services agreement. That news pushed up the stock by almost 50%, which is not unusual for these kinds of AIM "options". I have also jumped into the shark-infested waters of U.S. retail via a small punt on Urban Outfitters. It has no debt and if it continues to do more or less what it has been doing in the past decade, it is cheap. If the Amazon singularity happens, though, who knows what will happen [1]. Finally, I will also be adding slightly to my short in Spoos that I have been carrying for a month. After all, I am a sucker for a good cliché.
[1] - And yes, I know about the "pizza," and I actually think it is a pretty good idea to diversify this way. But let's just be clear that this will not be a salvation in the short run.


