
These Two Technical Indicators Signal Powerful Trends

Understanding and using technical indicators to guide your trading is not a sophisticated science. If you have a set of eyes, you can see recognizable patterns that repeat over and over again. You can then draw some conclusions based on what’s happened in the past and set up trades that have a high probability of success.
There are no guarantees of course, but human behavior rarely changes. Instead, it repeats.
Two “coincident” technical indicators I turn to are new highs/new lows and the bullish percent indicator. These show us the momentum of buyers and sellers in real time and provide us with some very power signals to follow.
New highs/new lows
New highs/new lows show how prices of individual stocks are doing, aka, what kind of response they’re getting from traders. I look at annual highs and lows to assess the health of the market. New highs often scare off new buyers, but when you view the data over time, you can see an accumulation (or distribution) pattern play out. This could be considered a yearly breadth indicator.
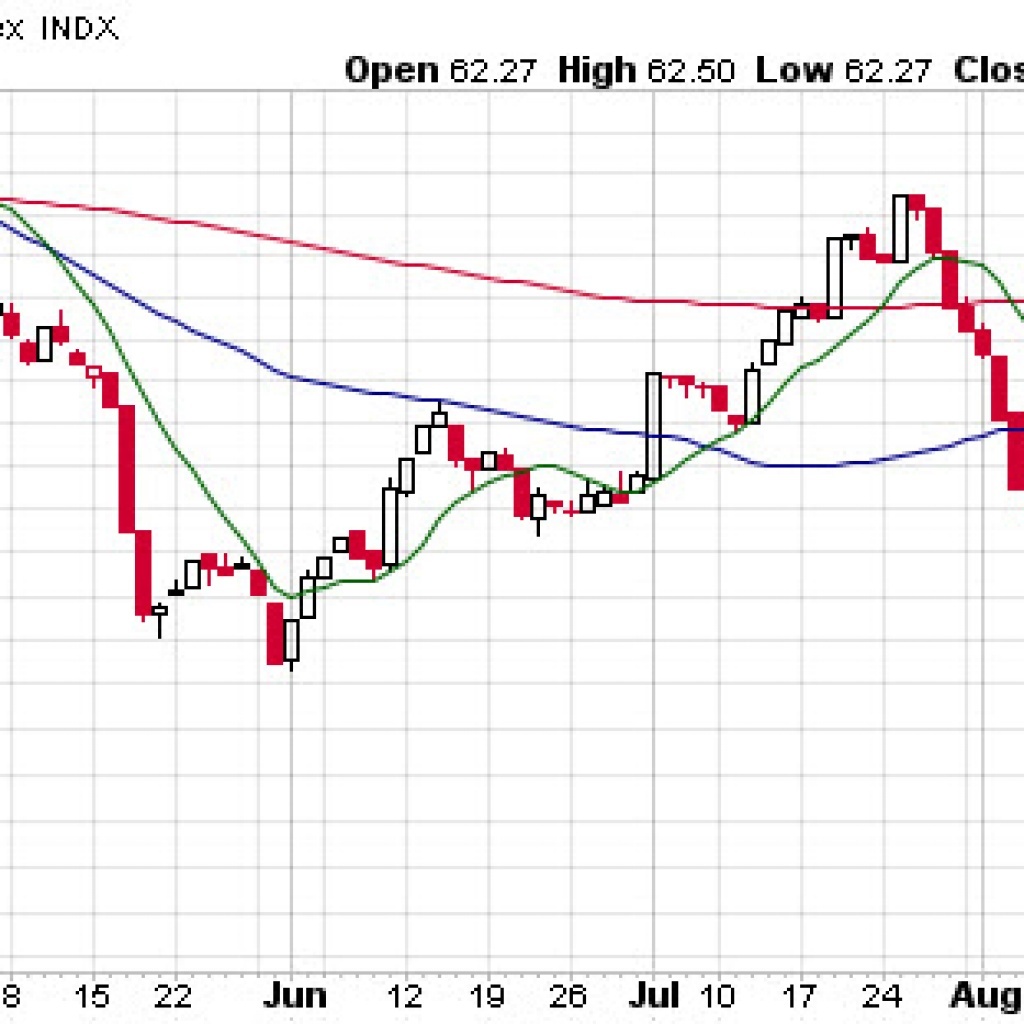
Recently new highs started to climb – but not to the levels we saw in July. However, the separation of highs versus lows started to widen, and that was significant. When buyers continue to push prices up, that trend tends to be quite bullish.
On the other hand, when new highs started to fall in August and new lows began to climb, that was a time to become a bit cautious. Indeed, we witnessed a couple of sharp declines during this time, but that soon passed.
Currently, new highs have expanded nicely and are likely to buoy stocks as they had previously. Strong price action attracts more money.
Bullish percent indicator
The bullish percent indicator signals how many stocks have a buy signal on a point/figure chart. This analysis plots price against changes in direction using x’s (prices rising) and o’s (prices dropping) in column boxes. Technicians have been using this form for many years, because it provides some very reliable signals. A key level to watch is 50. A cross below it could be considered rather bearish, while a cross above is bullish.
The bullish percent indicator for most indices (SPX, NYSE, Nasdaq and Industrials) hit an important inflection point in mid-August. We saw the indicator approach (but not reach) the 50 area. Instead, it turned higher and now has some very strong wind at its back. That is a good sign of health for the markets, with more stocks showing up in the “buy signal” column.
You could also look at the chart from a divergence standpoint, and your analysis could prove to be correct. For instance, the bullish percent is showing strong momentum now, but it is not anywhere close to the levels in July – and we are at all-time highs again. Further, the bullish percent only rallied to the June lows in the indicator, which may represent resistance – and a stall may be coming. We’ll have to see how it plays out, because other indicators are not in line with a bearish outcome.
The bottom line
These two technical indicators are not difficult to interpret, but they give us a good sense of market direction. Pay attention when they fire off strong signals (like they are now). Powerful trends have a tendency to continue onward.
Image Copyright: bluebay / 123RF Stock Photo
Disclosure: None.


It will be helpful, if links are provided to online source of indicators mentioned.
Agreed. Can you help us out @[Bob Lang](user:38898)?