
The Surprising Implications Of Periods Of Extremely Low Volatility – A Year Of Records
Trying to chase volatility higher has been like chasing fancy footwork.

The S&P 500 last completed a drawdown of 5% or more on November 4, 2016. That ended a period of pre-election weakness that began in early to mid-August, 2016. The last drawdown of 5% or more before that occurred around Brexit when the vote accelerated a near 3-week period of weakness. The S&P 500 lost 6% before a sharp rally quickly erased fears of a negative global fallout. Since these drawdowns, the biggest drawdown for the index was a 3% loss that ended six weeks of weakness on April 13, 2017.
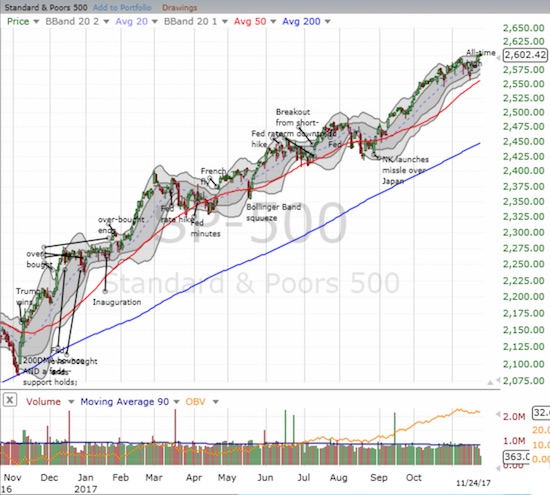
The S&P 500 (SPY) has all the markers of a very bullish year. Source: FreeStockCharts.com
This recent history of minimal pullbacks has occurred alongside periods of extremely low volatility (ELV). I define a period of extremely low volatility as one where the volatility index, the VIX, closes below 11. The period ends after the VIX goes 20 straight trading days closing above 11. When I first studied these periods, I made the surprising conclusion that ELV is more bullish than bearish. Conventional wisdom says that low volatility is “dangerous” and an indicator of big trouble ahead for the stock market. So I assumed that extremely low volatility would prove particularly alarming.
On the other hand, before this year, the last three periods of ELV DID proceed pullbacks of at least 5% for the S&P 500. Based on that streak, I set the clock for a 5% pullback in May. When on May 17th the S&P 500 swiftly lost 1.8% and the VIX soared an historic 46%, I thought validation was at hand. Instead, the index promptly reversed itself and ended the the month with a healthy 1.2% gain. Moreover, the period of ELV continued because volatility collapsed from 15.6 to 10.9 in just three trading days.
I soon reset the ELV clock for an August/September pullback. I also added a measure of ELVs that took into account the S&P 500’s distance from an all-time high. With that perspective, I observed a 50/50 chance that a period of ELV at or near an all-time high would precede a 5% pullback. August delivered some trouble for the S&P 500 with two days of significant selling. The VIX experienced another historic one-day pop, this time a gain of 44%. The agitation lasted longer than May’s churn including another large one-day jump for the VIX 5 trading days later. That gain was worth 32%. Yet, the VIX never closed higher than the day of the first spike. August ended with the VIX closing below 11 again, and the month even delivered a one point gain for the S&P 500. The VIX only managed to stay above 11 for 16 days, so the on-going period of ELV refused to end. The subsequent powerful September rally placed an exclamation mark on yet another bullish outcome for the period of ELV.
In other words, this year firmly placed its vote on the side of a bullish interpretation of periods of ELV.
Implications
The current period of ELV has lasted a record 151 trading days through November 24, 2017. This period includes a new all-time closing low for the VIX of 9.1 on November 3rd. Starting in June, the VIX challenged the former all-time low several times. The VIX started this week by dropping below 11 once again. This time, I am not resetting the clock. Instead, I am noting that the VIX has delivered a notable spike in volatility at least once every three months. I am also noting that record lows and record one-day spikes have comfortably (perhaps ironically?) co-existed this year. Time will tell whether conditions around the next spike in volatility will finally be bearish enough to deliver a significant pullback in the stock market.
With the latest period of ELV setting a record, anything becomes possible and I lack a framework for even guesstimating how much longer this period could last. In the future, I may find it necessary to redefine ELV as the VIX below 12 and/or shorten the dead period of 20 days in order to provide more refined and useful analyses.
The History
Here is another review of the history of periods of ELVs. Recall that data are available through Yahoo Finance starting in 1990.
There are 14 periods of ELV, including the current one. The list below includes the starting date for the period of ELV followed by the duration of the period measured in trading days. I put an asterisk next to the periods that preceded a 5% pullback in the S&P 500 as measured from the last day of the period of ELV to the intraday low of the day that delivered the first accumulated 5% loss (I used the intraday low as it represents the full extent of the market risk). In parentheses, I provide the S&P 500’s percentage distance from the last all-time high at the time the period of ELV started.
4/15/93: 1 (-1.7%)
7/9/93: 6 (-1.8%)
10/15/93: 1 (0%)
*12/13/93: 38 (-0.8%)
2/3/95: 15 (-0.7%)
*6/16/95: 1 (0%)
12/4/95: 14 (0%)
7/12/05: 13 (-20.0%)
11/21/05: 35 (-17.8%)
*3/14/06: 14 (-15.1%)
*10/13/06: 90 (-10.6%)
*6/6/14: 20 (0%)
1/25/17: 27 (0%)
4/24/17: 151 and counting (-0.9%)
I also revised the VIX distribution chart (through November 17, 2017). This year has spent so much time with ELV that the VIX’s time between 10% and 11% has gone from 1.8% to 2.7%. For example, since 2015, the VIX has spent 10% of its time between 10 and 11 and 5.5% of its time between 9 and 10. Perhaps it is only a matter of time before the VIX sets new all-time records and breaks down below 9! Moreover, given the historic spikes this year, another record low in the VIX would likely accompany more historic spikes on the way to the record or following the record.
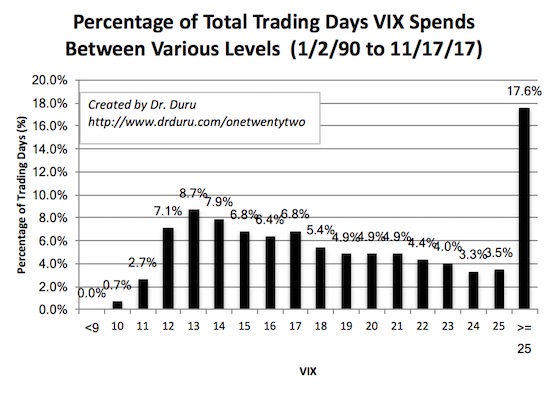
Overall, the VIX spends precious little time below 11.
Read the x-axis as follows…Since January 2, 1990, the VIX has spent 2.7% of its trading days between 10 (inclusive) and 11 (exclusive). Over this time, the VIX has experienced 17.6% of its trading days at or above 25. Flipped around, the VIX has spent 82.3% of its trading days below 25. The VIX has spent 1.9% of its trading days below 11.
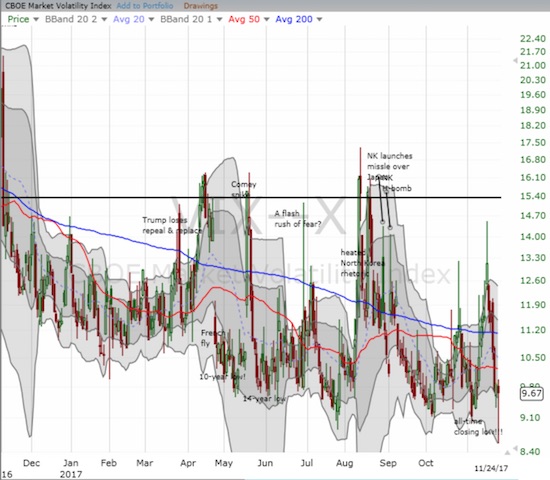
Even with two historic spikes, the VIX has had a downward bias throughout 2017. Source: FreeStockCharts.com
Betting on volatility
Finally, note that CBOE Global Markets, Inc. (CBOE) continues to deliver an excellent way to bet on volatility through the increased trading in volatility products. CBOE is up 38.6% since my last volatility post – surely one of my biggest misses of the year. The volatility faders keep getting bolder and the bears keep trying to bet on that ever elusive volatility run-up.
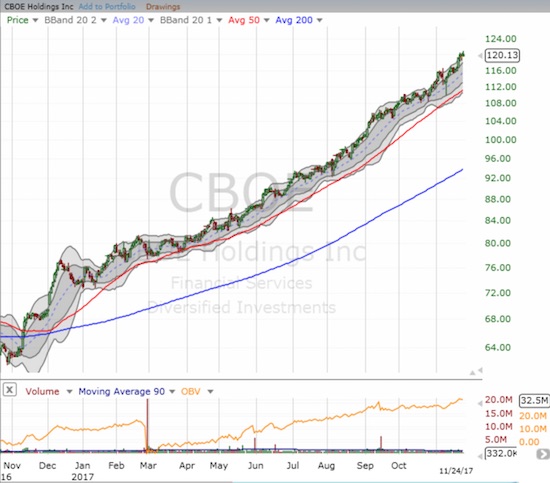
CBOE Global Markets, Inc. has not taken a breather during an incredibly impressive run-up in 2017.
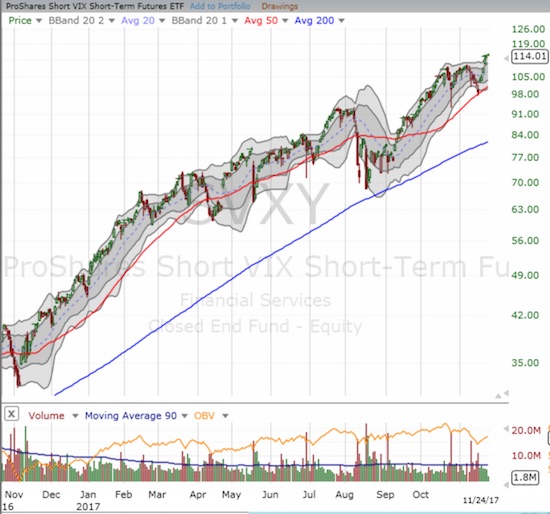
ProShares Short VIX Short-Term Futures (SVXY) shows off the value of fading volatility all year. SVXY has almost TRIPLED in 2017!
Source: FreeStockCharts.com
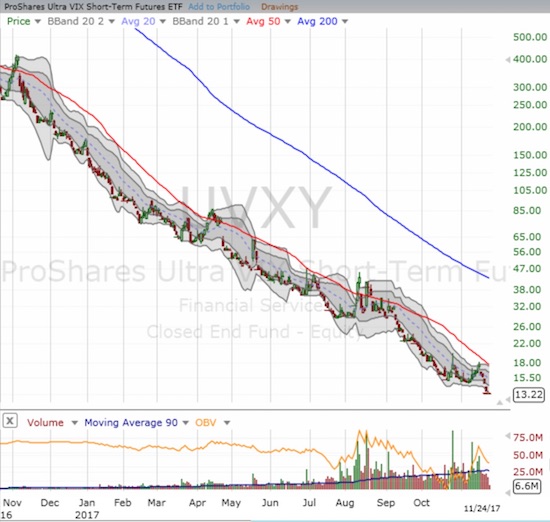
ProShares Ultra VIX Short-Term Futures (UVXY) is the flip side of the volatility story. Its near uninterrupted decline is why I buy my call option hedges on two week cycles.
Be careful out there!
Full disclosure: long UVXY call options
Follow Dr. Duru’s commentary on financial markets via more


I have never had the stomach for trading UVXY--neither to the short nor long side. It seems like eventually leveraged volatility instruments will exact punishment on both sides of the trade. First the longs, then the shorts who think shorting vol is *still* the path to endless gains.
The trade is truly treacherous. I only use UVXY for periodic hedges right now. Based on my latest review of the VIX data, I am going to stretch out the frequency.
Low volatility does create potential new highs but there is risk of a pullback simply through a reversal of the low volatility like the author points out. It gets dangerous here but may be equally rewarding. It's great for churners but not necessarily for regular investors. I'd take some less volatile and more passive holdings and not just chase me too stocks like Google and Facebook from here on out. You may miss some gains but if you do acquire more here, make sure you are fast enough to pull the trigger and sell if you need to on a downturn.
Seasonality implies folks should be through year-end. Let's see what January/February bring.