
The Insane Fibonacci Levels Of TransEnterix
Fibonacci levels are used in technical analysis to assess the probability of a financial asset retracing its original move in price. The Fibonacci ratios utilized are 23.6%, 38.2%, 50%, 61.8%, 100%, 161.8%, 261.8%, and 423.6%. When connecting an extreme high and an extreme low price point of a financial asset, the Fibonacci ratios more often than not represent future support and resistance levels.
Take the recent move in the S&P 500 as an example.
Click on picture to enlarge

The Fibonacci levels of the 2007 high and the 2009 low created many points of support and resistance that have been continually tested during this 6 ½ year bull market, with the 161.8% retracement level being the most recent level tested.
TransEnterix (TRXC) has an extreme high and an extreme low that is ideal for Fibonacci analysis. After completing their reverse merger with Safestitch Medical, the stock briefly jumped to $14 per share on thin volume in early 2014. A few months later, the stock sold off to $1.40 on news that the SurgiBot would be delayed by six months. A total drawdown of 90%.
Click on picture to enlarge
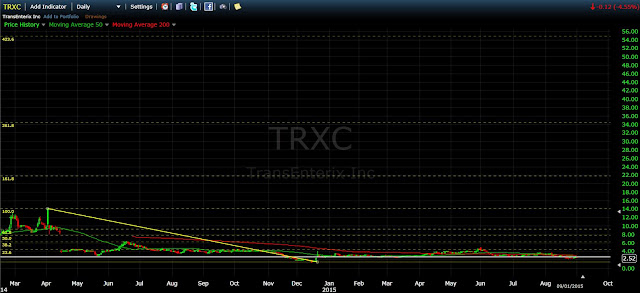
Utilizing the extreme high and low of TransEnterix for Fibonacci analysis yields these retracement levels:
Fibonacci Level Price Objective Current Upside +%
161.8% $21.80 772%
261.8% $34.41 1276%
361.8% $47.02 1780%
423.6% $54.82 2092%
If the fundamentals behind TransEnterix plays out as I anticipate over the next 5+ years, I will be keeping an eye on these technical targets. Recall the fundamental case I laid out earlier in the year.

Technicals and fundamentals go hand in hand. You need to have both strong fundamentals and strong technicals to have a real winner. In my view, TransEnterix has both (long term).
For reference, let’s take a look at ISRG shortly after its IPO. The stock opened at $18.00 and hit a high of $38.13. Nine months later, the stock hit a bottom at $6.00. A total drawdown of 84%. Utilizing the high and low as Fibonacci inputs, you can clearly see points of old resistance and support.
Click on picture to enlarge

Two conclusions I draw from the above chart are: 1) It takes years for long term Fibonacci levels to play out, and 2) 423.6% Fibonacci level in no way represents the top. Onwards and upwards!
Disclosure: I am long TransEnterix. I continue to buy shares of TransEnterix and plan on doing so in the future. I have a multi-year investment horizon in TransEnterix.


