
Tech Talk: Ford Motors
(Click on image to enlarge)
As I have mentioned in recent posts – this one, for example – I am getting cautious about this market, which has now been in bull mode for eight long years. Having already claimed the mantle of second-longest on record, today marks the start of the ninth year of the U.S. stock bull, according to the Globe and Mail.
As a reminder on these matters, take a look at my commentary on the longest-running bull and bear markets during the last two hundred years.
And that brings me to my cautionary tale: In a low-interest environment, when you are unsure about the markets, buy something that pays you a decent dividend. In that spirit, I bought some Ford (F) shares, which provide a stable 4% annual return. Now, what’s the story about Ford? Let’s go back to the beginning.
“Any customer can have a car painted any colour that he wants so long as it is black,” Henry Ford said when he was transforming manufacturing with the new-fangled moving assembly line. This system, which began operations on October 7, 1913 at a plant in Michigan, reduced production time for a Model T Ford to just 93 minutes. The system could produce cars quicker than the paint of the day could dry, so Ford would not compromise on the matter of colour. He provided good cars cheaply, but without the frills.
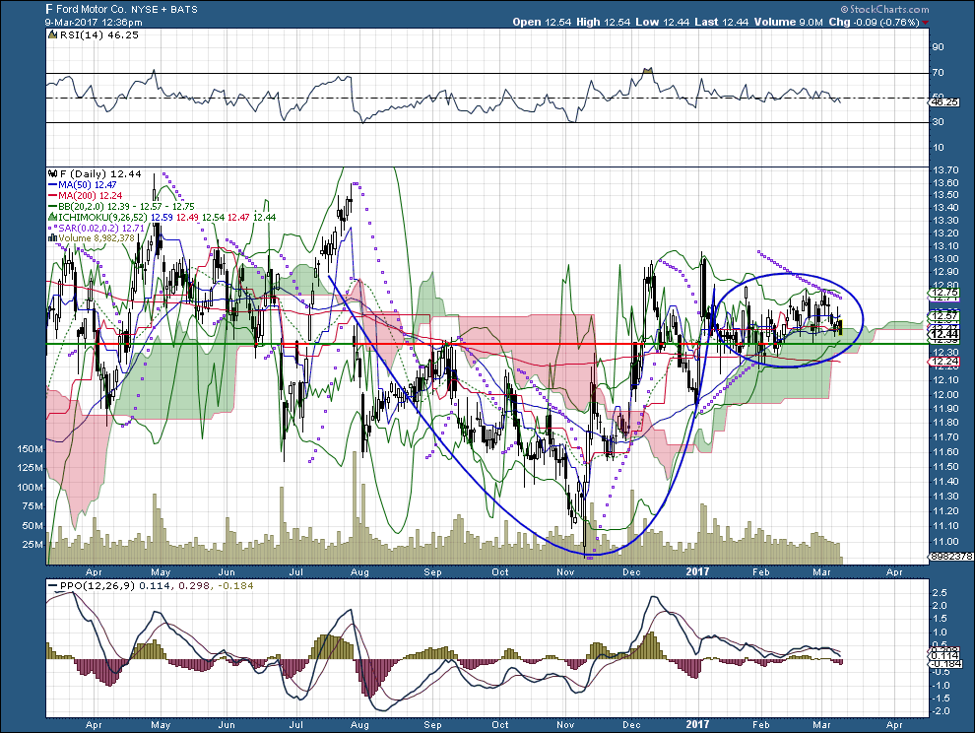
The chart at the beginning of this article depicts the most recent year in the life of Ford. After a year of drifting, Ford dropped in anticipation of the election, then rallied. At the moment, it seems to be the handle in a cup-and-handle formation. The red and green Auto Support and Resistance line depicts what I consider to be a stable price point.
Now, take a look at the following five-year chart. The shares have been stable for the last four years, though they have underperformed the markets by a big margin.
(Click on image to enlarge)
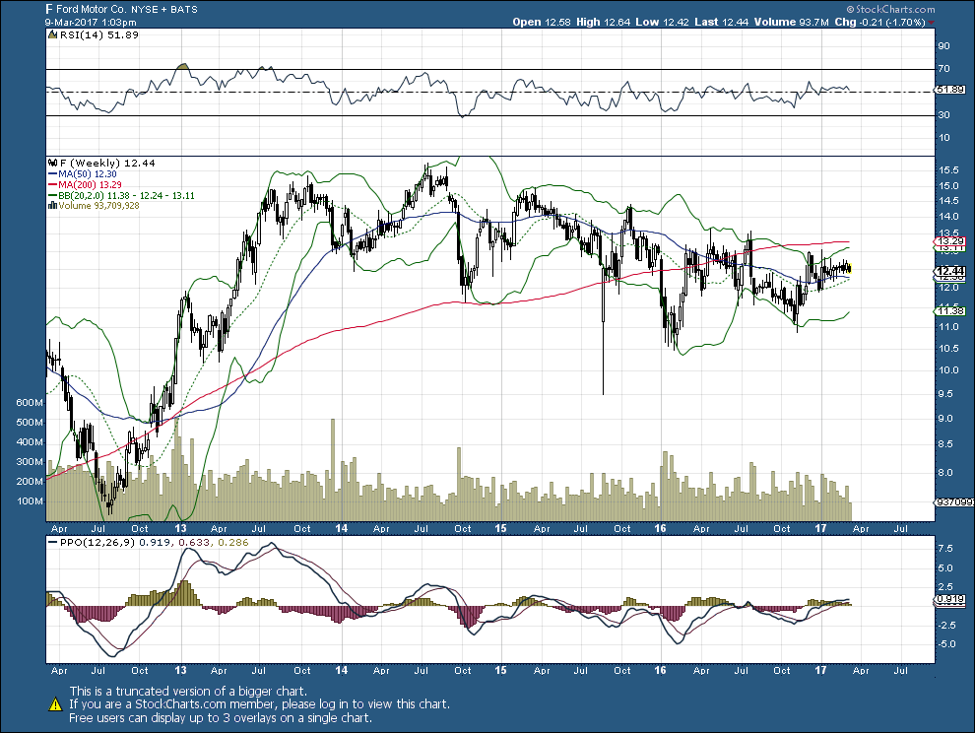
To my mind that is a bit of a plus. The company has released plans to go beyond its petroleum-fuelled vehicles, and produce more electric-powered and self-driving models. That, it seems to me, is the wave of the future. The dividend is for now; the recovery of one of the most important industrial corporations in history is for later.
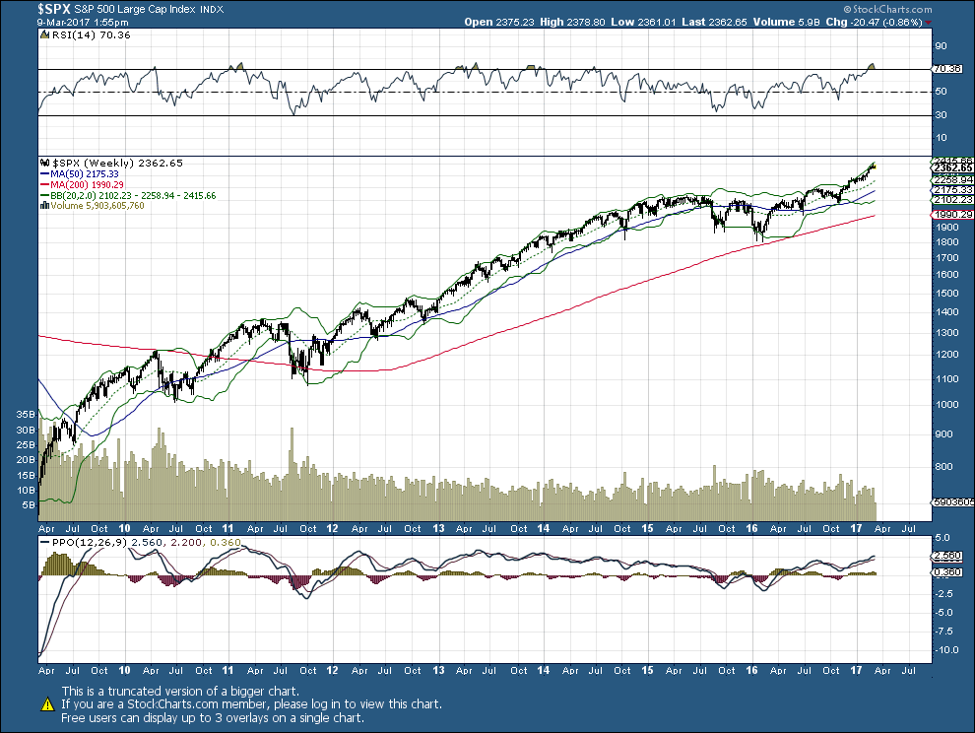
For the record, the following chart shows how the S&P 500 has performed since March 9, 2009. During those years it has risen from 676.53 to 2362.65.
(Click on image to enlarge)
Disclaimer: The analysis and ideas presented here should never be seen as a buy or sell recommendation. I am an active trader, but I discuss stocks for informational purposes only. By reading my ...
more

