
T2108 Update – A Surprising Bullish Divergence
(T2108 measures the percentage of stocks trading above their respective 40-day moving averages [DMAs]. It helps to identify extremes in market sentiment that are likely to reverse. To learn more about it, see my T2108 Resource Page. You can follow real-time T2108 commentary on twitter using the #T2108 hashtag. T2108-related trades and other trades are occasionally posted on twitter using the #120trade hashtag. T2107 measures the percentage of stocks trading above their respective 200DMAs)
T2108 Status: 37.5%
T2107 Status: 387%
VIX Status: 12.1
General (Short-term) Trading Call: Neutral
Active T2108 periods: Day #195 over 20%, Day #3 over 30% (overperiod), Day #10 under 40%, Day #50 under 50%, Day #67 under 60%, Day #266 under 70%
Reference Charts (click for view of last 6 months from Stockcharts.com):
S&P 500 or SPY
SDS (ProShares UltraShort S&P500)
U.S. Dollar Index (volatility index)
EEM (iShares MSCI Emerging Markets)
VIX (volatility index)
VXX (iPath S&P 500 VIX Short-Term Futures ETN)
EWG (iShares MSCI Germany Index Fund)
CAT (Caterpillar).
Commentary
The important turn-around in the stock market that I described on Tuesday, July 28, 2015 continued one more day as the S&P 500 (SPY) managed to break above its 50-day moving average (DMA) yet again. The Federal Reserve once again delivered calm, solace, and comfort to financial markets even as the latest statement on monetary policy provided no clues on the timing for lift-off for interest rates. The S&P 500 stalled over the last two days.
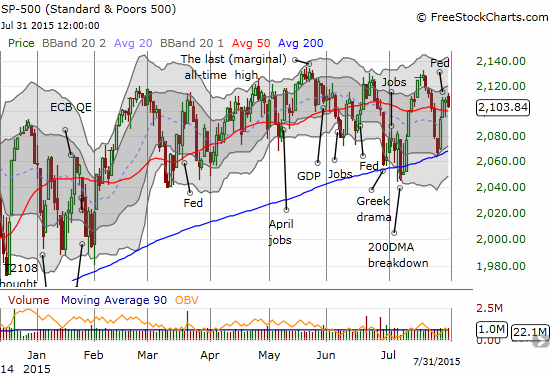
The S&P 500 is back to its chopping ways
Interestingly, while the S&P 500 closed marginally lower to end the week, T2108 had a VERY strong day. T2108 closed up a startling 10.2%! This was a very surprising bullish divergence. I could not casually identify what group of stocks did so well to cause T2108 to diverge so strongly from the index. The Nasdaq (QQQ) closed flat after fading from its highs. Ditto for the Guggenheim S&P 500 Equal Weight ETF (RSP). Notably, the iShares Russell 2000 (IWM) closed up 0.6%, but this hardly seems enough to drive such a strong move for T2108. Even T2107, the percentage of stocks trading above their respective 200DMAs, had a strong day with a 4.5% gain. If the market experiences buying follow-through on Monday, I will consider it a confirmation of a definitive bullish bias and turn for the market.
One huge caveat impeding the path of bullishness (the trading bias is neutral) is the extremely low level of the volatility index. The VIX is scraping at recent lows, and I have a hard time believing the VIX will stay this low for much longer given recent history.
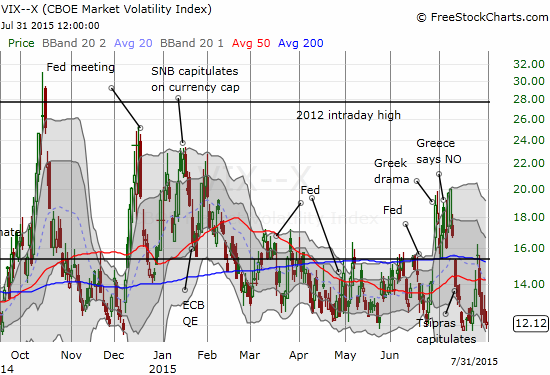
The volatility index is back to recent lows – but for how much longer?
As a precaution, I went back to my favorite hedge: Caterpillar (CAT). The stock delivered my big gain of last week with an aggressive buy of call options. Now, CAT is back to its normal role serving as a hedge to bullishness. The chart below still suggests CAT found a bottom, so I am not expecting a lot of (short-term) downside from here – perhaps a retest of the low in the case of a fresh market sell-off.
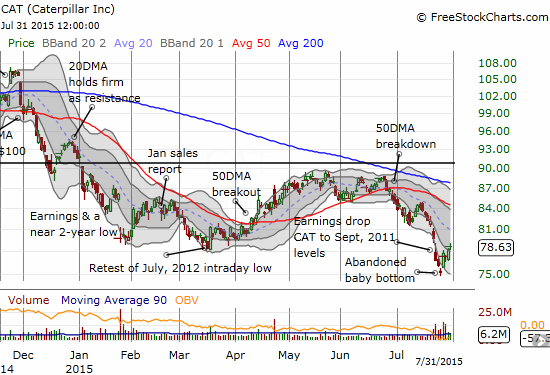
Can Caterpillar (CAT) complete a reversal of post-earnings losses? Or is the current pause the end of the recovery from 4-year lows?
Earnings season started with a bang for internet-related stocks with the likes of Google (GOOG), Netflix (NFLX), and Amazon.com (AMZN) experiencing monster surges. The past week was like a mirror image with major internet-related disappointments featuring major gap downs. For example, LinkedIn (LNKD) beat on its previous quarter, guided higher for the current quarter and the entire fiscal year and still got slammed for a 10.5% loss. I think this move is overdone; I fully expect in due time this gap will get filled. I bought some speculative call options on this bet. I even sat on a tidy profit on a good intraday bounce given my conviction. I may pay for it given LNKD had a weak close!
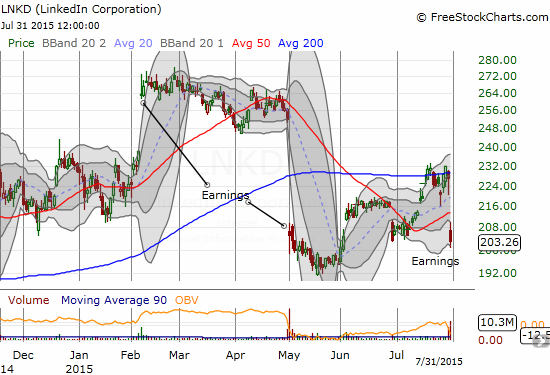
LinkedIn (LNKD) reverses its last rally. in what has become extremely choppy trading from week to week.
I also made a short-term play for Baidu (BIDU). The stock triggered a day late, but I decided to give it a try anyway. The trade was looking good on Thursday, but Friday’s weak close puts the trade in early jeopardy. If only I did not have such great hesitation on trading Chinese stocks, I sure would have already played BIDU for the strong bounce off its lows – it is a common pattern for the stock.
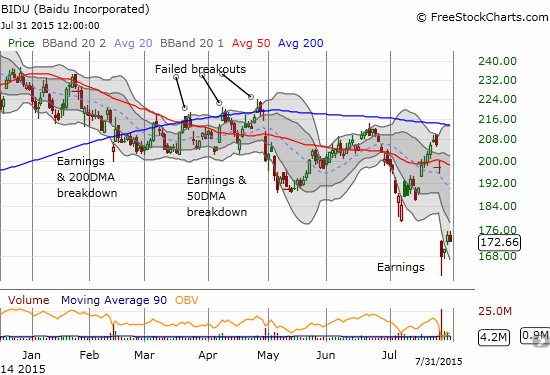
Baidu (BIDU) has already traveled fr from its post-earnings low. Is the buying interest now ending?
Daily T2108 vs the S&P 500

Black line: T2108 (measured on the right); Green line: S&P 500 (for comparative purposes)
Red line: T2108 Overbought (70%); Blue line: T2108 Oversold (20%)
Weekly T2108

*All charts created using freestockcharts.com unless otherwise stated
The charts above are the my LATEST updates independent of the date of this given T2108 post. For my latest T2108 post click here.
Related links:
The T2108 Resource Page
Expanded daily chart of T2108 versus the S&P 500
Expanded weekly chart of T2108
Full disclosure: long LNKD call spread and other call options, long BIDU call options, long CAT put options


