
Straits Times Index STI Supporting Stock Market Bulls
Straits Times Index (STI) is regarded as the benchmark index for the Singapore stock market. It tracks the performance of the top 30 companies listed on the Singapore Exchange. It is jointly calculated by Singapore Exchange (SGX), Singapore Press Holdings (SPH) and FTSE Group (FTSE).
Applying the One Market concept, we know that major world indices around the world are oscillating on the same cycles. In the following chart, we overlay STI with 3 different indexes from USA (SPX), Germany (DAX) and Japan (NIKKEI) still we notice STI is trading in the same direction as the rest.
Overlay of STI, SPX, DAX, NIKKEI

Since the 2008 Financial crises, the majority of indexes around the world recovered and made new all time highs and the cycle fro; 2009 is still in progress despite the media keeps calling for a big crash. In the next Chart, we’ll apply the Elliott Wave Theory on Straits Times Index to identify the current structure taking place.
STI Weekly Elliott Wave Chart
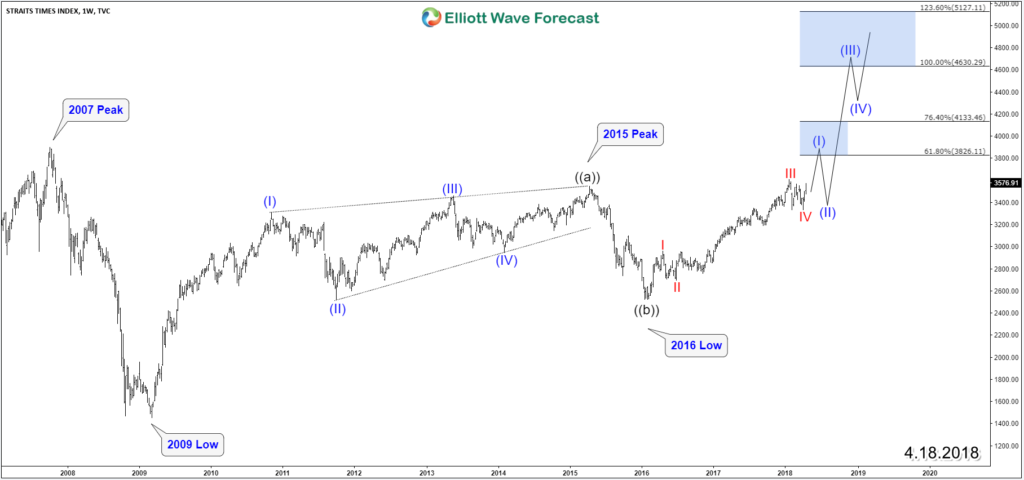
From 2009, STI did 5 waves move in a diagonal which ended on 2015 peak followed by 3 waves pullback into early 2016 low like the rest of the stock market. Up from there it started a new 5 waves impulse to the upside and managed to break above 2015 peak. This move created a bullish sequence to the upside and opened the door for the Index to trade higher toward equal legs area 4630 – 5120.
Ideally, this move to the upside should be seen around the globe as major Indices are expected to continue their rally in the coming years before a major peak can take place on 2020 – 2022.
Switching to the daily chart of Straits Times Index, we can notice that the instrument seems to have ended the current correction from January and could have already resumed the move higher even there is still a possibility of a double correction lower as long as it remain below January peak.
STI Daily Scenario 1 Elliott Wave Chart
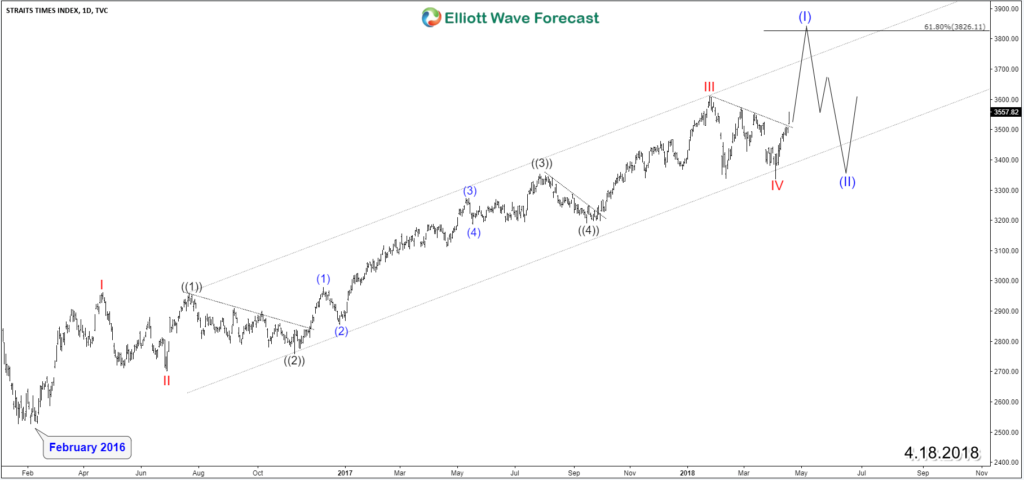
After the index breaks to new highs, it will be looking to reach the 61.8% fib ext area 3826 – 4133 which would produce a 3 waves pullback before more continuation to the upside. However depending the on the speed & timing of the move, the index could have different structure taking place and can be labeled on different way.
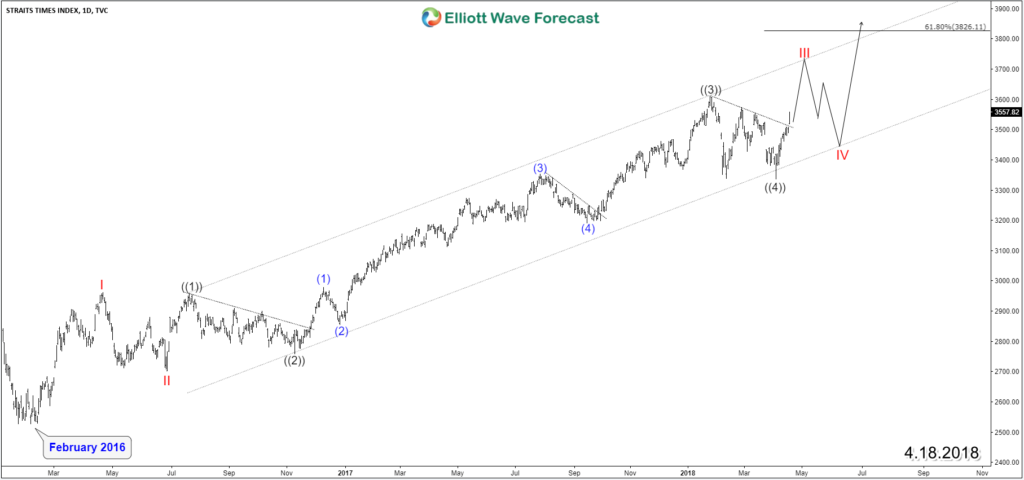
A less aggressive scenario would suggest that STI is still looking to end wave III of (I) of the impulse from 2016 low which implicate another extra 2 legs to take place before it reaches the 61.8% and most likely will take more time into 2018.
STI Daily Scenario 2 Elliott Wave Chart
Recap
Straits Times Index is showing an Elliott Wave bullish structure from 2016 low supporting more upside around the global stock market and despite the instrument still needs to break to new highs to confirm the next leg higher, there is still more scenarios can be taking place later on depending on the structure of the move.
Disclaimer: Futures, options, and over the counter foreign exchange products may involve substantial risk and may not be suitable for all investors. Leverage can work against you as well as for you. ...
more

