Stocks Short Term Elliott Wave Bounce Is Purely Technical
Stocks and ETFs follow the same code in the market same as the rest of financial instruments like Forex. Every 5 waves impulsive structure is followed by a technical corrective sequences which come in 3-7-11. At the end of the corrective sequence, usually, the instrument will resume the move within the main trend or at least correct the previous cycle.
Recently, we saw a bounce taking place around the stock market in most of the sectors and the media as usual came out with all kind of explanation related to politics and economy. However, we at Elliott Wave Forecast understanding the nature of the market is ruled by the technical aspect and have nothing to do with fundamental news which comes in the second place to drive the price to a pre-determined direction.
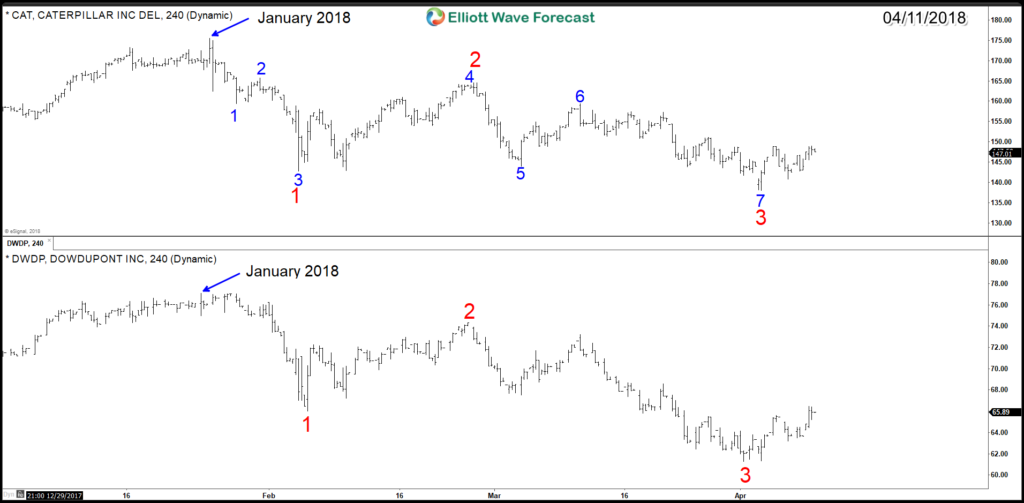
Firstly, we will take a look at this chart of Caterpillar (NYSE: CAT ) and Dowdupont (NYSE: DWDP) representing 2 different sectors. Both stocks declined in clear 3 swings ( red ) from January peak and specifically, CAT did 7 swings ( blue ) if we count the internal structures.
Stocks Swings Sequence Count ( CAT & DWDP )

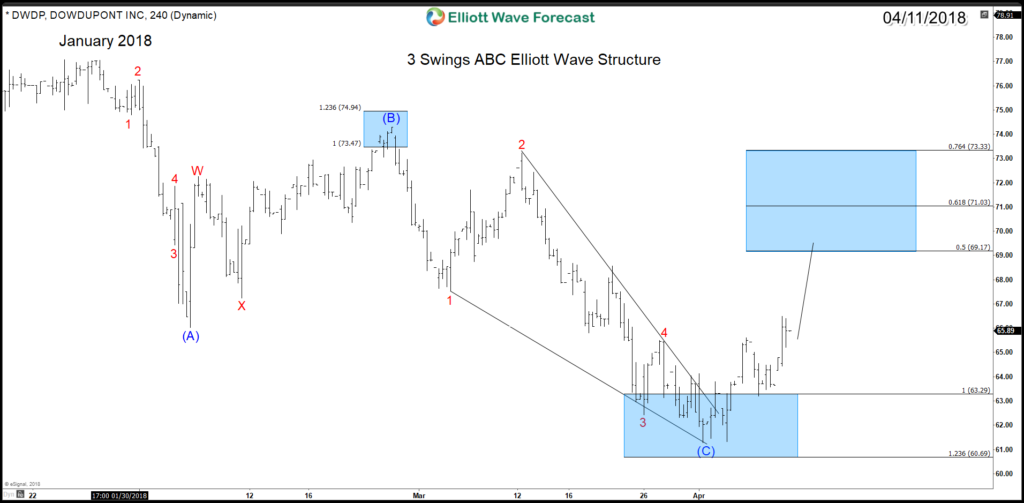
In the Classic 3 swings ABC zigzag structure, the Market does 5 waves move, then it corrects in 3 waves followed with another 5 waves move to the same direction of the previous 5 waves. DWDP did manage to finish the 3 swings around equal legs area $63.29 – $60.69 from where it started the bounce higher to at least correcting the previous cycle from January peak toward 50% area $69.17.
DWDP 4H Chart 04/11/2018 : 3 Swing ABC Elliott Wave Structure

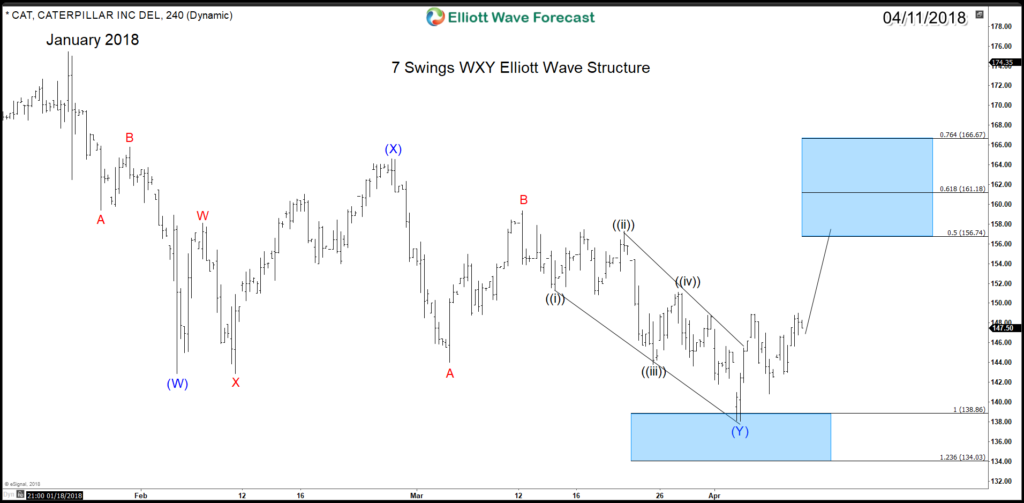
In the 7 swing WXY double three structure, the Market does 3 waves move, then it corrects in 3 waves followed with another 3 waves move to the same direction of the previous 3 waves. In total, it has 7 swings which can be seen in the 4H Chart of CAT as the stock has been declining since January in corrective structures.
CAT 4H Chart 04/11/2018 : 7 Swing WXY Elliott Wave Structure

Conclusion
We do understand the nature of market and how the One Market concept works, therefore the bounce which took place recently from blue box area was seen all over the stock market despite some instrument didn’t reach their perfect target to the downside. Our Blue Box in extension gets reached around 85% of the time and they represent the High-frequency areas where the Markets are likely to end cycles and make a turn.
Consequently, the short Term Bounce is purely an Elliott Wave technical move as stocks did a corrective structure from January peak before buyers show up around extreme area to provide support as expected.
Disclaimer: Futures, options, and over the counter foreign exchange products may involve substantial risk and may not be suitable for all investors. Leverage can work against you as well as for you. ...
more


