S&P 500 Index In A Range In Long Term Uptrend
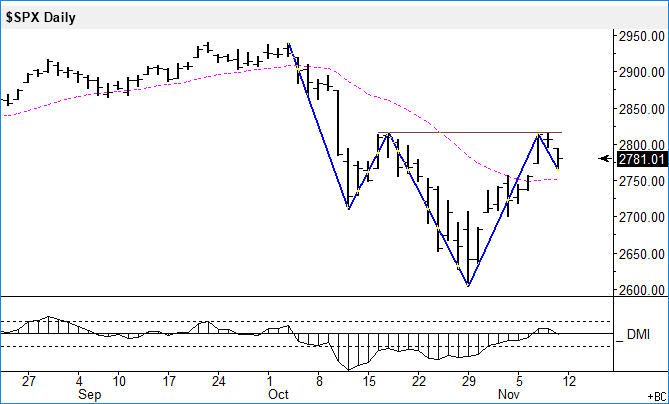
Starting with the daily chart, the S&P 500 index is currently on a downswing in a downtrend. The last upswing was larger than prior upswing so I am expecting the index to rise above the 2817 level, if it can stay above the moving average line (2751).
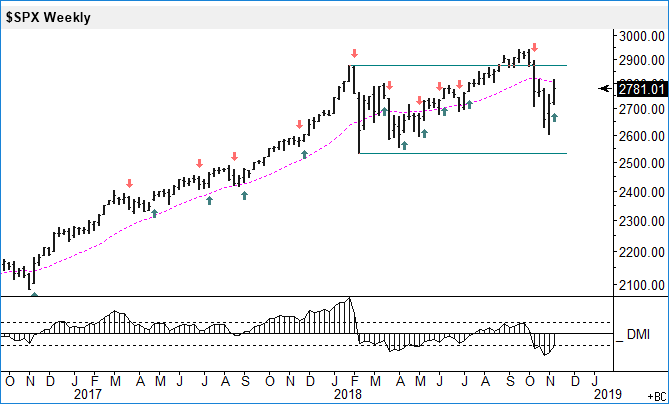
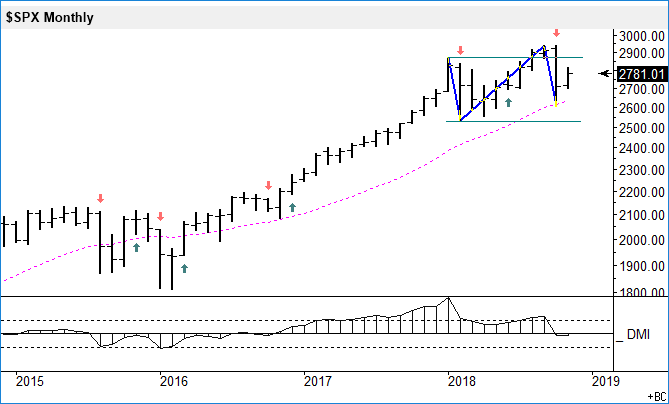
The weekly chart shows this year as a range within an uptrend and the index is currently on an upswing. The lower boundary of range comes inat 2533. Looking at the monthly chart, the index is on a downswing in a range in an uptrend. Based on my weight of the evidence approach, I consider the longer term trend to be up and thus expect higher index levels, as long as it stays above 2533.


Disclosure: The analysis provided here is usually part of the analysis the author uses when he is designing and managing his investment portfolios.
Disclaimer: The analysis presented ...
more


Hello. i need to believe s & p500, i'm playing s & p500 index