
Should You Buy Union Pacific Stock?
Union Pacific Corporation (UNP) is the largest railroad in North America, the company operates on 32,000 miles of track covering 23 states across the U.S. Union Pacific connects the Pacific and Gulf Coast ports with the Midwest and eastern United States gateways. The company also connects with Canada's rail systems with the six major gateways to Mexico. More than 90% of revenue comes from freight transportation, with a particular focus on agricultural products, energy, industrial products, and premium freight.
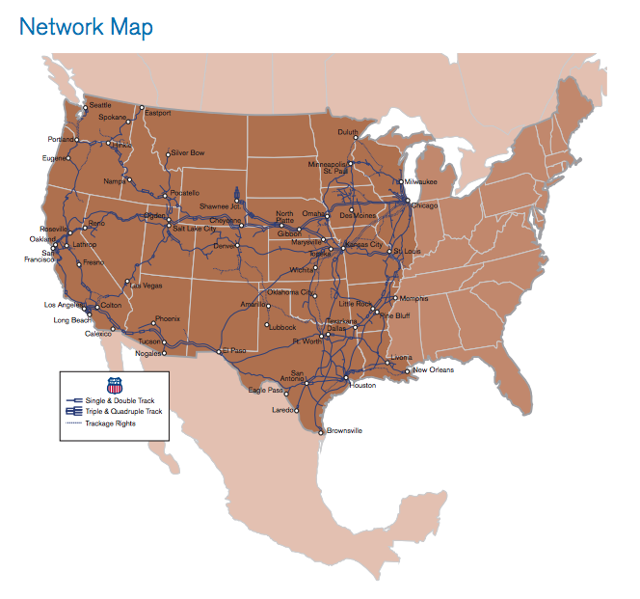
Source: Union Pacific.
Railroads have an attractive business model. It doesn’t make much economic sense to build a new railroad in a region already covered by existing operators, so competition is quite limited. In comparison to trucks and aircraft, railroads are the best low-cost option for transportation, especially for freight with a low value per unit. Efficient scale, in combination with industry deregulation and consolidation since the 1980s, have allowed many companies in the sector to generate attractive profitability for investors over the past several years.
It's not easy for companies in the industry to find new opportunities for organic growth, and the sector is quite sensitive to the economic cycle. Nevertheless, Union Pacific has delivered solid financial performance over the long term, with key variables such as revenue, operating income, free cash flow, and earnings per share moving in the right direction over time.
UNP Revenue (NYSE:TTM) data by YCharts
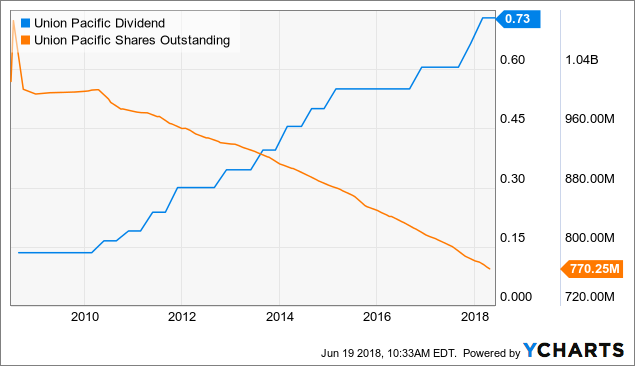
The business consistently makes more cash than it needs to retain, a clear sign of underlying fundamental quality. Management is committed to rewarding investors with growing dividends and recurrent share buybacks over the years. The chart below shows how dividends have increased and the amount of shares outstanding has declined over the past decade.
UNP Dividend data by YCharts
The company reported solid financial performance during the first quarter of 2018. Operating revenue amounted to $5.5 billion during the quarter, up 7% versus the same quarter in 2017. Business volumes, as measured by total revenue carloads, increased 2% year-over-year. Volume increases in energy, industrial, and premium more than offset a decline in agricultural products during the quarter.
Operating income totaled $1.9 billion during the quarter, up by 8%. Growing sales, expanding margins, a smaller effective tax rate, and a reduction in the amount of shares outstanding allowed Union Pacific to generate $1.68 in diluted earnings per share during the quarter, a vigorous increase of 27% versus the first quarter in 2017.
Reasonable Valuation
Even the strongest company can be a mediocre investment when valuation is too high. But that’s hardly the case when it comes to Union Pacific, since the company is priced at fairly reasonable levels. The forward price to earnings ratio stands at 16.98, roughly in line with a forward price to earnings ratio of 16.5 for the average company in the S&P 500 index.
The table below compares valuation ratios for Union Pacific versus Canadian National Railway (CNI), CSX Corporation (CSX), Norfolk Southern (NSC), and Canadian Pacific Railway (CP). Looking at dividend yield, forward price to earnings, price to earnings growth, price to sales, and price to book value, valuation numbers for Union Pacific are broadly in line with industry standards.
|
Ticker |
Dividend |
Fwd P/E |
PEG |
P/S |
P/B |
|
UNP |
1.99% |
16.98 |
1.29 |
5.27 |
4.67 |
|
CNI |
1.71% |
18.37 |
1.75 |
6.08 |
4.78 |
|
CSX |
1.33% |
17.55 |
1.37 |
4.94 |
4.07 |
|
NSC |
1.87% |
16.1 |
1.35 |
4.08 |
2.66 |
|
CP |
0.90% |
17.08 |
1.29 |
5.43 |
5.63 |
Healthy Momentum
Stock prices reflect not only fundamental performance, but fundamental performance in comparison to market expectations expectations can have a huge impact on a stock. When a company is delivering better-than-expected numbers and forward-looking expectations are also moving upwards, this generally means the stock price is moving in the right direction too.
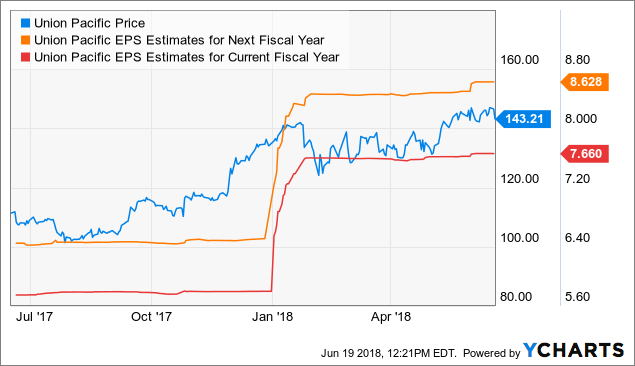
Union Pacific reported both earnings and sales above analysts estimates last quarter, and Wall Street analysts are raising their earnings forecasts for the company. The chart shows how the stock price and earnings expectations are understandably moving together over time.

UNP data by YCharts
There is also a considerable degree of consensus among the analysts following the stock. Looking at earnings estimates for the current quarter, next quarter, the current year, and next year, Union Pacific is receiving far more upward revisions than downward revisions to earnings estimates.
|
EPS Revisions |
Current Qtr. (Jun 2018) |
Next Qtr. (Sep 2018) |
Current Year (2018) |
Next Year (2019) |
|
Up Last 7 Days |
10 |
8 |
13 |
15 |
|
Up Last 30 Days |
12 |
8 |
15 |
18 |
|
Down Last 7 Days |
N/A |
N/A |
N/A |
N/A |
|
Down Last 30 Days |
N/A |
2 |
N/A |
N/A |
Vigorous Relative Strength
Strength begets strength in the stock market, meaning that companies that are outperforming the market in general and the sector in particular tend to continue doing so in the middle term. Besides, money has an opportunity cost. When you buy a stock that is delivering below-average performance, then you are missing other opportunities with superior returns. Yo don't just want to buy stocks that are doing well on a standalone basis, you really want to buy stocks that are doing better than other alternatives.
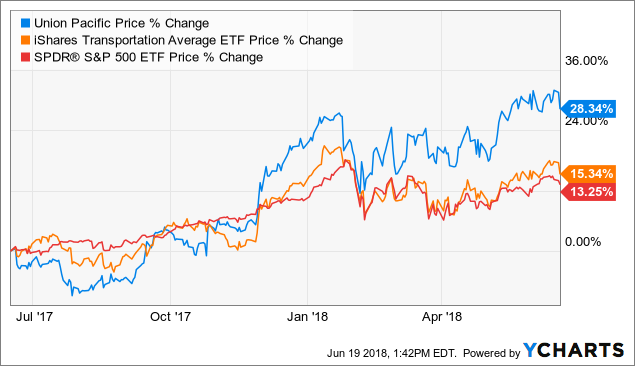
UNP data by YCharts
Union Pacific stock is materially outperforming the iShares Transportation Average ETF (IYT) and the SPDR S&P 500 Trust ETF (SPY) over the past 12 months. Winners tend to keep on winning, so relative strength is a powerful tailwind for Union Pacific stock over the coming months.
Putting It All Together
The PowerFactors system is a quantitative investing system available to members in my research service, "The Data Driven Investor." This system basically ranks companies in a particular universe according to the factors analyzed in this article for Union Pacific: quality, valuation, momentum, and relative strength.
The system has produced solid backtested performance over the long term. The chart below shows how the 50 stocks with the highest PowerFactors ranking in the S&P 500 index performed in comparison to the SPDR S&P 500 ETF since 1999. The backtesting assumes an equal-weighted portfolio, monthly rebalanced, and with an annual expense ratio of 1% to account for trading expenses.
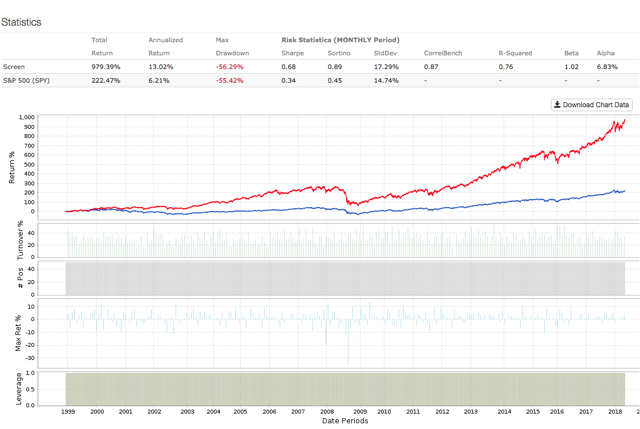
Data from S&P Global via Portfolio123
The system more than doubled the benchmark, with annual returns of 13.02% per year versus an annual return of 6.21% for the market-tracking ETF in the same period. In other words, a $100,000 investment in the SPDR S&P 500 ETF in January of 1999 would currently be worth around $322,500, and the same amount of capital allocated to the PowerFactors system would have a much larger value of $1.8 million.
Union Pacific is one of the stocks currently recommended by the PowerFactors system, and the company gets high scores across the four factors considered: quality, valuation, momentum, and relative strength. If backtested performance is any valid guide, then Union Pacific is well positioned for attractive returns going forward.
Disclosure: I/we have no positions in any stocks mentioned, and no plans to initiate any positions within the next 72 hours.
Disclaimer: I wrote this article myself, and it expresses my ...
more

