
Should You Buy Micron Stock?
Micron Technology (MU) is a top player in memory chips. The company’s main products are non-volatile memory chips and dynamic random access memory (DRAM) products. Micron sales its products to industries such as PC and smartphone manufacturers. This means that the company has benefited from material growth opportunities over the past several years, but industry demand is also quite cyclical and hard to predict.
In spite of this industry cyclicality, Micron has delivered solid financial performance over the long term, with key variables such as revenue, free cash flow, and earnings per share moving in the right direction over time.
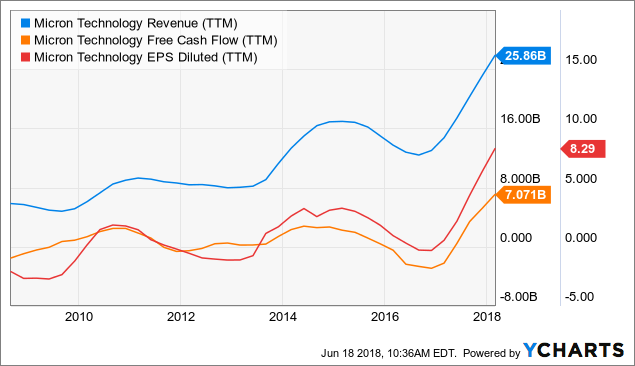
MU Revenue (NYSE:TTM) data by YCharts
The company reported rock-solid performance last quarter. Total revenue during the second quarter of fiscal year 2018 amounted to $7.3 billion, growing 58% versus the same quarter in the prior year and increasing 8% in comparison to the first quarter of 2018.
Profitability is also expanding: Consolidated gross profit margin came in at 58.1% of revenue during the second quarter of 2018, a significant increase versus 55.1% in the first quarter of 2018.
Management sounds quite satisfied with the company’s financial performance, and optimistic about its future potential. In the words of Micron President and CEO Sanjay Mehrotra:
"Micron executed exceptionally well in the second quarter, delivering record results and strong free cash flow driven by broad-based demand for our memory and storage solutions. Our performance was accentuated by an ongoing shift to high-value solutions as we grew sales to our cloud, mobile and automotive customers and set new records for SSDs and graphics memory. Secular technology trends are driving robust demand for memory and storage, and Micron is well-positioned to address these growing opportunities."
Corporate management is obviously an interested party in this discussion, and comments from corporate executives should always be taken with a grain of salt. Nevertheless, industries such as data centers, mobile computing, automotive, and internet of things could offer plenty of opportunities for growth in the years ahead.
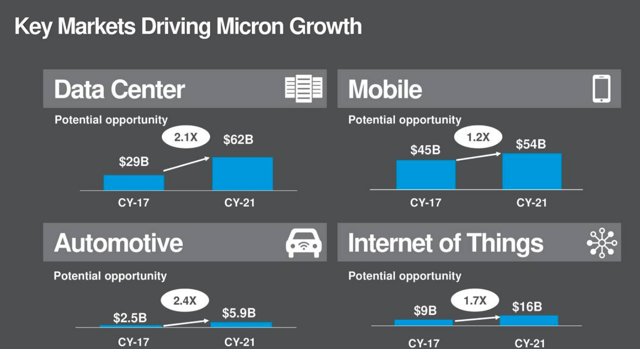
Image Source: Micron.
Attractive Valuation
It’s hard to argue against the fact that Micron is priced at remarkably convenient valuation levels. Wall Street analysts are on average expecting the company to make $11.56 in earnings per share during fiscal year 2018. Based on this assumption, the stock is trading at a bargain-low forward price to earnings ratio of 5 times earnings expectations.
Companies in the semiconductor industry typically trade at a discount versus the broad market because of industry risk and cyclicality. Nevertheless, even by industry standards, Micron looks remarkably cheap.
The table below compares valuation levels for Micron versus the average company in the semiconductors and semiconductor equipment industry. Looking at typical valuation ratios such as price to earnings, price to earnings growth, price to sales, price to cash flow, and price to book value, Micron is priced at a discount versus the industry average across all of the indicators considered.
|
Micron |
Industry |
|
|
P/E |
7.06 |
29.48 |
|
PEG |
0.24 |
1.35 |
|
Price/Sales |
2.79 |
3.31 |
|
Price/Cash Flow |
5.03 |
21.95 |
|
Price/Book |
2.81 |
3.26 |
Strong Momentum
Stock prices reflect certain expectations regarding fundamental performance. If the numbers are below expectations the stock will probably suffer, even if the business remains healthy. On the other hand, when the company is doing better than what the market expects, this can push expectations higher, which generally means that the stock price is moving higher too.
Micron has a solid track-record at consistently outperforming expectations. The chart below shows the expected earnings number, the actual reported number, the difference between the two figures, and the earnings surprise in percentage terms for Micron in the past four quarters.
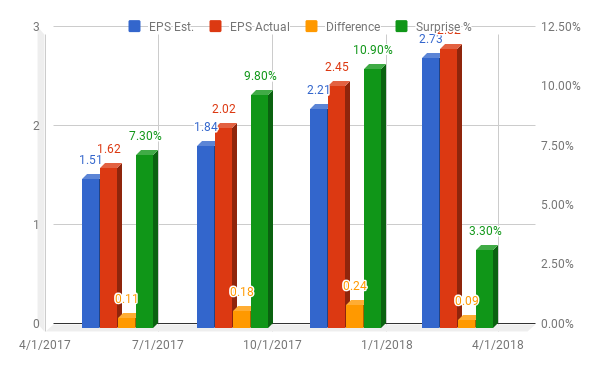
On a forward-looking basis, Wall Street analysts have material increased their earnings forecasts for Micron over the past year. The chart shows the stock price in comparison to earnings estimates for both the current year and next fiscal year. Unsurprisingly, the stock price and earnings forecasts tend to move in the same direction over time.

MU data by YCharts
Powerful Relative Strength
Money has an opportunity cost, when you buy a stock with mediocre returns, that capital is not available for investing in companies with superior potential. Besides, winners tend to keep on winning in the stock market, so you want to invest in stocks that are not only doing well but also doing better than other alternatives.
Semiconductor stocks have performed remarkably well in the past year, as expressed by a 29.06% gain for the VanEck Vectors Semiconductor (SMH) ETF versus a 13.87% gain for the SPDR S&P 500 (SPY) in the same period. Micron stands out as an outperformer in a particularly strong group, since the stock has gained 93.97% in the past 12 months.
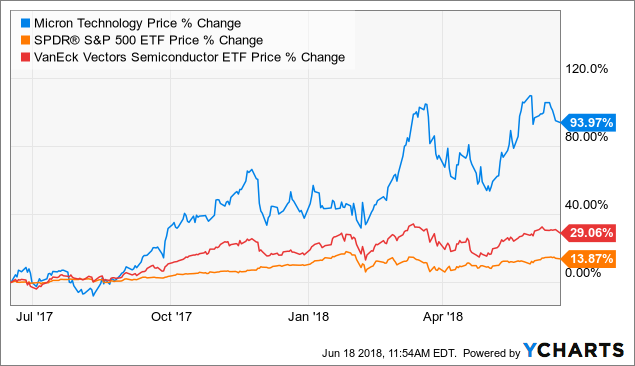
MU data by YCharts
Micron does not leave much to be desired in terms of relative strength, and this bodes well for investors in the company over the middle term.
Putting It All Together
The PowerFactors system is a quantitative investing system available to members in my research service, "The Data Driven Investor." This system basically ranks companies in a particular universe according to the factors analyzed in this article for Micron: quality, valuation, momentum, and relative strength.
The system has produced solid backtested performance over the long term. The chart below shows how the 50 stocks with the highest PowerFactors ranking in the Russell 3000 index performed over time.nThe backtesting assumes an equal-weighted portfolio, monthly rebalanced, and with an annual expense ratio of 1% to account for trading expenses. The benchmark is the iShares Russell 3000 ETF (IWV).
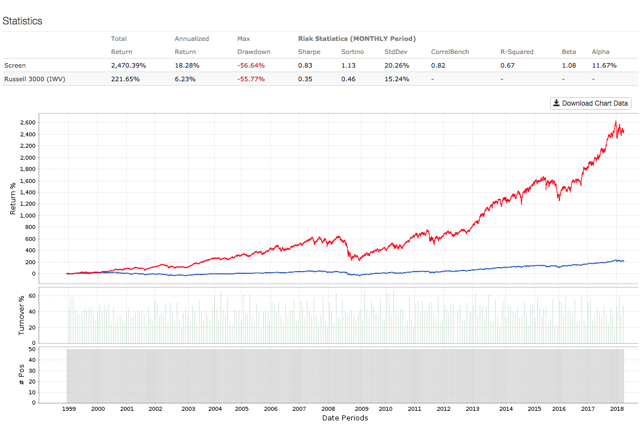
Data from S&P Global via Portfolio123
The system materially outperformed the benchmark, with annual returns of 18.28% per year versus an annual return of 6.23% for the market-tracking ETF in the same period. In other words, a $100,000 investment in the Vanguard Total Market ETF in January of 1999 would currently be worth around $321,600, and the same amount of capital allocated to the PowerFactors system would have a much larger value of over $2.57 million.
Micron is one of the stocks currently recommended by the PowerFactors system, and the company gets high scores across the four factors considered: quality, valuation, momentum, and relative strength. According to the quantitative data, Micron stock is well-positioned for attractive returns going forward.
Disclosure: I am/we are long MU.
Disclaimer: I wrote this article myself, and it expresses my own opinions. I am not receiving compensation for it. I have no business relationship with ...
more

