
Reviewing Berkshire Hathaway’s Third Quarter Earnings
Sometimes having access to torrents of information can be a blessing in addition to a curse. Berkshire Hathaway has is watched so closely that the noise too often drowns the reality. Last quarter I began reviewing Berkshire Hathaway’s earnings reports, both for insights into the company that it gives as well as the glimpses received of the overall economic environment. This past Friday, November 4th, Berkshire reported its third quarter earnings for the year. After reviewing the quarter’s performance, valuation assumptions will be updated for both the Class A and Class B shares.
The information presented will generally include a comparison of Q3 results, first nine month results, and full year 2015 results to gauge trends and be organized by the divisions typically laid out in the Annual Report.
Insurance
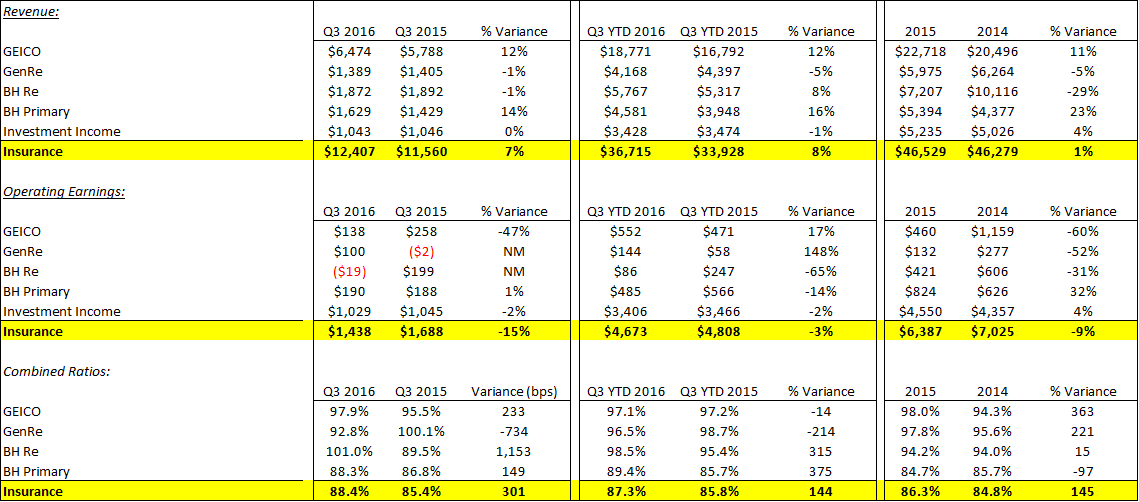
Source: Berkshire Hathaway SEC Filings
Insurance underwriting results were mixed, with strength in the primary lines and mediocrity in reinsurance, likely a reaction to ongoing pricing trends. Reinsurance premiums were close to flat versus double digit increases at both GEICO and the other primary lines.
Ajit Jain took responsibility for Gen Re this past May and placed Kara Raiguel in charge following the retirement of Tad Montross, so it’s a source of interest to follow the financials of the division to see how they evolve. In August it was reported that Jain outlined several areas in which he felt Gen Re could improve. Among them was a reduction in management layers to reduce costs as well as a change in the incentive system which was previously designed to reward margins rather than overall profitability. By most accounts Tad Montross ran Gen Re successfully and the company recovered extraordinarily well from the problems that beset it at the time of Berkshire’s acquisition in 1998. There are times, though, when one gets the sense that the scars from that time left its mark on the division and that there are instances in which it has become too risk-averse. Premium trends have improved as the year has progressed, with a 1% decline in Q3 versus a 7% decline in Q2 and a 5% decline year-to-date. More impressively, profitability has dramatically increased with about $.07 in underwriting income in the third quarter this year versus break-even results in the preceding year.
GEICO’s business continues to expand. Although approximate, it is probably now writing about 12% of all auto insurance premiums in the United States. Profitability has been challenged somewhat compared to its historical record in recent years. Pricing was increased last year in order to react to increased losses and in the quarter an increase in policies was responsible for 5% growth in premiums and pricing for the remaining 7%. Despite the higher pricing, both claims expenses and operating expenses increased from the previous year as a percent of earned premiums. In the case of claims, the number of claims did not rise disproportionate to premiums, meaning the average severity was to blame for the increased claims ratio. The rise in expenses might be a prelude to a very good fourth quarter as it seems they were a reaction to a sharp increase in the need to service new policies.
Consolidated float continued to increase at $91 billion versus $88 billion at year end 2015 and $90 billion at the end of the last quarter - impressive considering the reinsurance environment. It would be an oversight to not mention that Berkshire will be an extraordinary beneficiary of higher interest rates. With a relatively conservative and short duration bond portfolio and enormous cash balances, Berkshire’s investment income line (which was relatively unchanged from the previous year) is quite leveraged to short term interest rates.
Burlington Northern Santa Fe
BNSF has had a difficult year, but did seem to enjoy some sequential improvement in the third quarter from the second. Here are the raw figures.
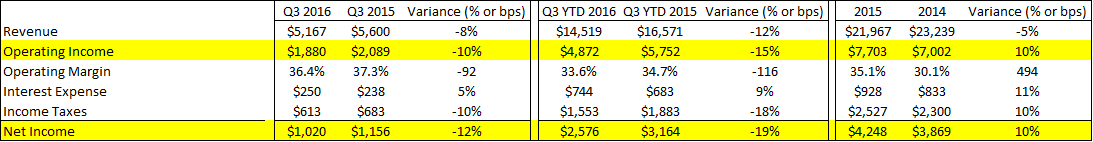
Weakness in the energy and industrial sectors continued to weigh down the railroad, but third quarter revenue and income both outperformed the year-to-date metrics. But, even the weakest parts of the company – for instance, coal – seem to be in the process of bottoming off of extremely weak comparisons.
Both volume and price were about 6 ½% lower than the previous year, but practically the entirety of the consolidated pricing decrease was due to lower fuel surcharges.
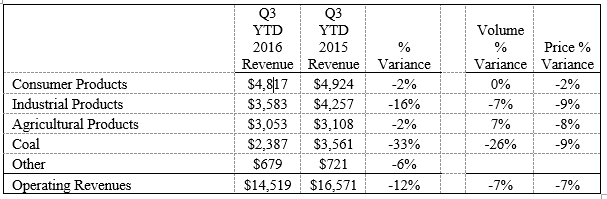
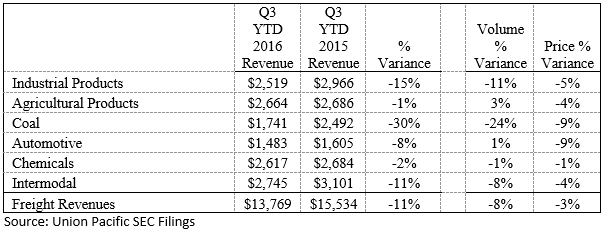
Union Pacific remains the best comparison to BNSF and looking at a segment breakout of Union Pacific YTD leads me to believe the two companies continue to perform roughly in-line with each other, although BNSF is probably performing slightly better.
The only way to summarize the current state of BNSF is to say that it’s being managed well through a difficult period.
Berkshire Hathaway Energy
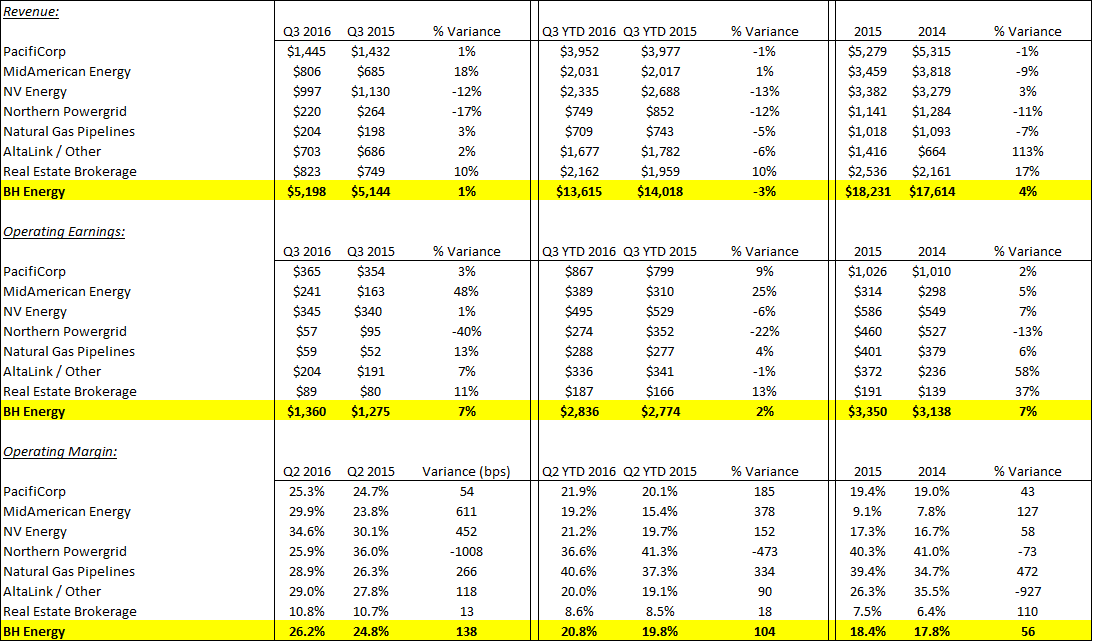
Short term revenue swings in the utilities business are not usually worth following – many factors from pass through costs to weather can be responsible. For Berkshire Hathaway Energy’s Northern Powergrid and AltaLink units, revenue comparisons also include foreign exchange swings.
Mid-American’s increase, though, is worthy of some discussion. The 18% growth was completely out of trend for the unit that primarily supplies power to Iowa households. Per the independent SEC Filing that Berkshire Hathaway Energy completes, electric revenues increased by 18% and gas revenues increased by 9%. In the year to date period, electric revenues increased by 7% versus a decline of 14% for gas revenues. So some of the difference is simply changes in pass through natural gas expenses as they compared to the previous year. But it does also seem that higher wholesale and retail rates are benefiting both the top and bottom lines for the unit.
The real estate division also continues to benefit from an improved market. After a good increase in profitability last year, the division has racked up another 13% increase so far this year and is on track to well exceed $200 million in operating income.
Manufacturing, Service, & Retailing
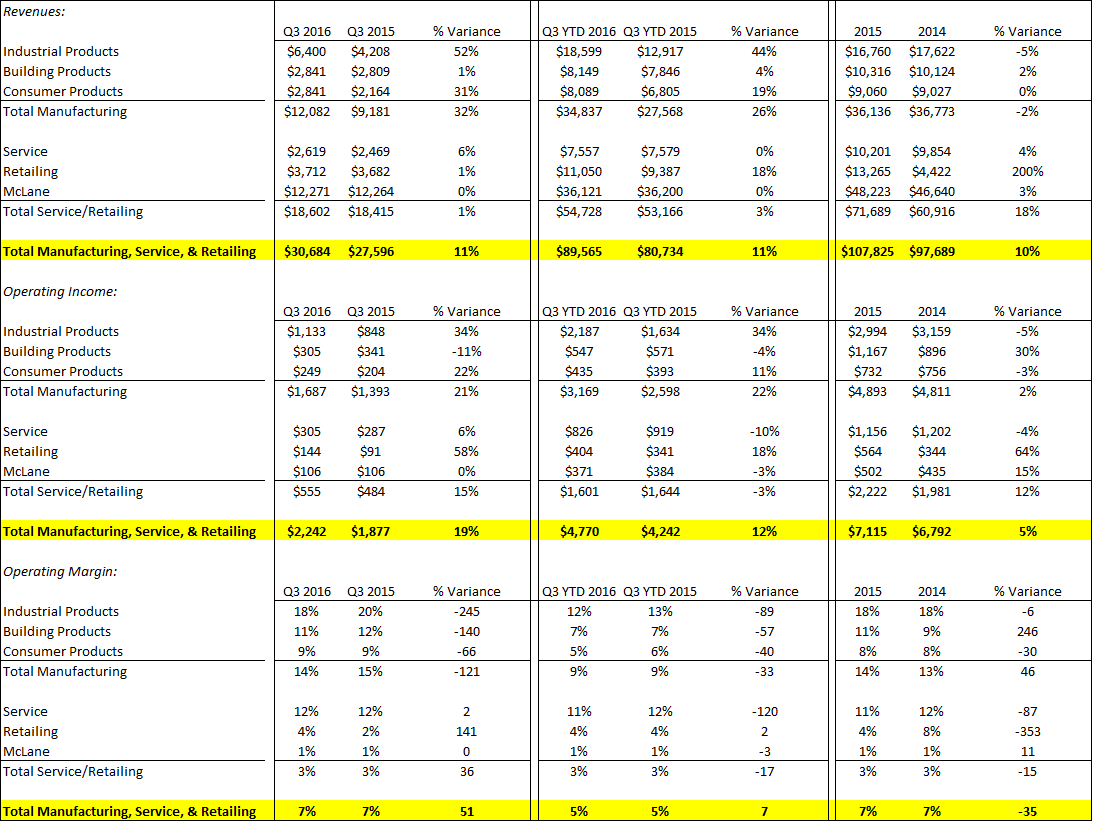
Practically all of the perceived growth in these businesses is the result of the inclusion of results from Precision Castparts (from January 29th) and Duracell (from February 29th). Excluding Precision Castparts, third quarter revenue for industrial products would have declined by 5% instead of growing by 52% as reported. Pre-tax earnings would have declined by 7% in the third quarter and 6% year-to-date.
Aggregating these businesses together does not produce any truly surprising results, but it does continue to illustrate the tough corporate environment – particularly in the industrial space from a strong dollar and weak energy demand.
Finance and Financial Products
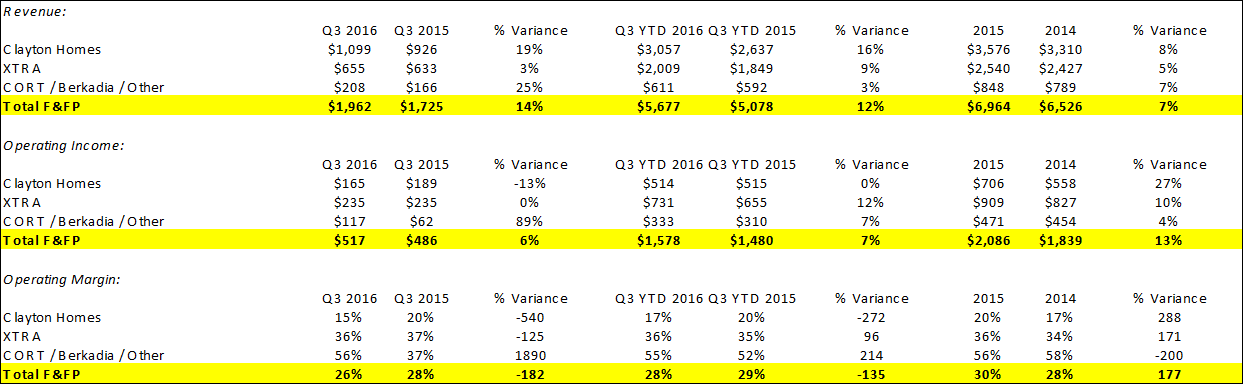
On the whole, the Finance and Financial Products businesses turned in another good quarter and are on pace to a very fine year.
There is one metric that deserves careful attention. It seems that delinquencies on Clayton Homes’ portfolio of loans has started ticking upward. As of the end of Q3, 6% of the book was delinquent versus 5% at the end of Q2. To a considerable degree, I think increased loan loss reserves was the reason for weaker margins at Clayton. This is likely environmental rather than being related to underwriting quality. Nevertheless, it should be something to be careful to watch heading into Q4.
Notes and Balance Sheet Items
Book value per share at the end of Q3 was $163,782, an increase of more than 5% from the end of 2015. Annualized, that represents growth of about 7%.
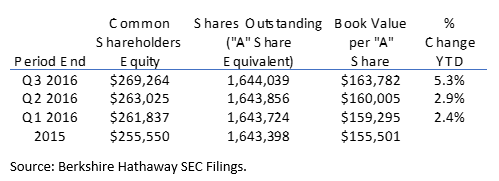
Aggregate cash at Berkshire is now $84.8 billion, up from $71.7 billion at year end, although only $68 billion is held within the insurance and other categories.
Finally, the equity index put options written by Berkshire improved income by $458 million and the residual liability on the balance sheet is close to $4 billion. There are an average of four years remaining on the contracts and if they were settled today the liability to Berkshire would be $1.6 billion.
Valuation
As I did after Berkshire’s Q2, let’s walk through how Berkshire’s valuation currently looks on a price to book basis, two-column approach, and look through earnings approach.
At today’s close of $233,750 Berkshire’s current price to book multiple is 1.43x. That’s elevated somewhat from its recent history of average of price to book multiple of ~1.3x but is not out of line of longer term historical multiples.
Taking the two-column approach to investments and earnings estimates that intrinsic value is about $280,000 and that the current price is a 17% discount to that value.
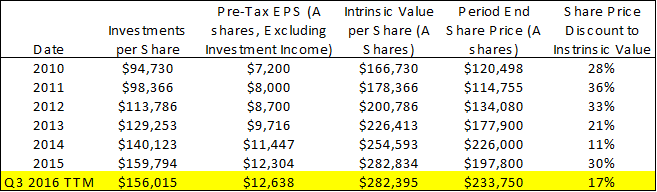
There are some limitations to this approach. For one, Berkshire has shed investments and cash in order to purchase Precision Castparts and Duracell but has yet to fully experience the earnings from those acquisitions.
The best method of calculating Berkshire’s value remains the “look through” approach, where undistributed earnings of investments are added back to Berkshire’s income in order to estimate the true earnings power of the assets that the company owns.
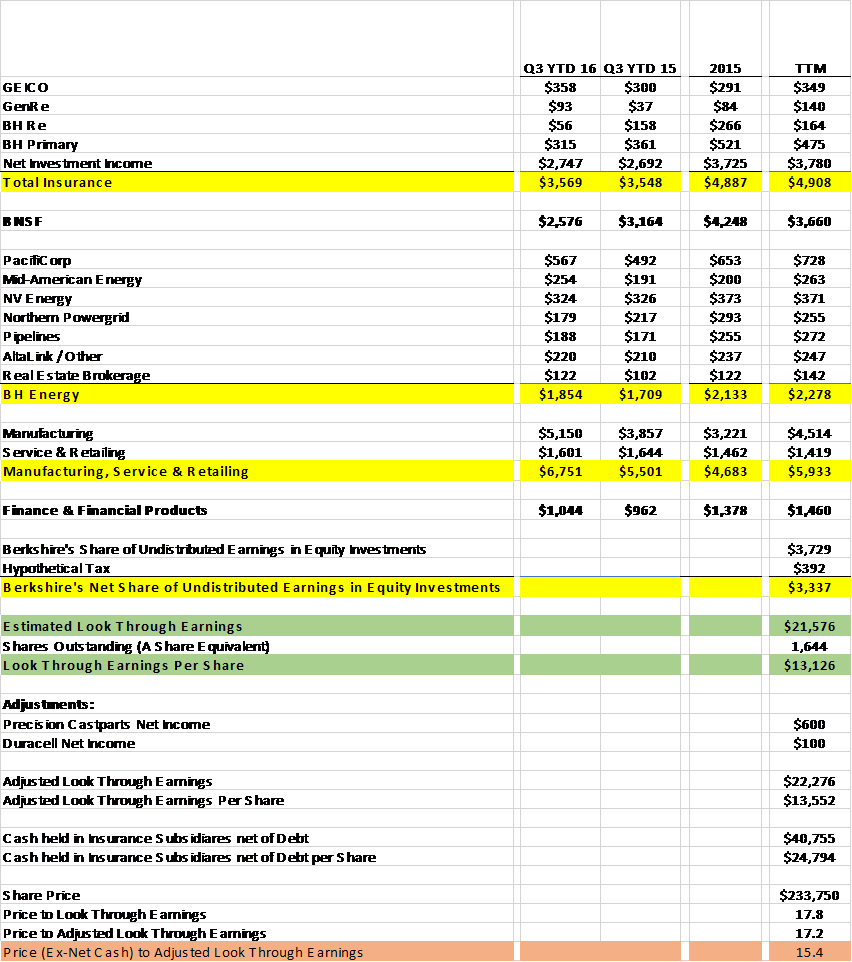
Source: Morningstar and Berkshire Hathaway SEC Filings
Backing out net cash in the insurance operations and Berkshire Hathaway trades for about 15 times its earnings power, which is cheap compared to the overall market.
Summary
Berkshire managed its way through a tough third quarter and its results showed continued strain, particularly in the industrial economy. Still, its competitors have to manage through the same environment and if one is weighing Berkshire Hathaway against an indexed fund a strong argument can be made for Berkshire outperforming over the next decade. Whether that becomes a reality will largely depend on how and when the large cash hoard will be deployed.


Beware of #Berkshire, it is looking more and more like a conglomerate than a savvy well managed value investment vehicle. $BRK-A
@[Moon Kil Woong](user:5208), can you elabroate on why you say that about #Berkshire? $BRK-A.
Berkshire has reached a scale any additional investments they do have very little effect on the whole and although Buffet managed the investments as investments well and took active roles in them, this is a rarity more than the norm. One can not expect management to remain this savvy.
It's certainly a conglomerate. But why is that bad? $BRK-A
Conglomerates are frowned upon by value investors and even Warren Buffet. Generally they become unmanageable, they often swap assets from profitable to unprofitable sections of the business which lowers value not creates it, and it becomes hard to determine what exactly you are investing in. There are innumerable reasons why conglomerates vastly underperform regular companies besides the simple fact that they do so.
I agree with you that conglomerates can be managed poorly and are more complex enterprises than more focused businesses. But, if managed well they provide a very large opportunity - the ability to expand investment options beyond those normally available. There are conglomerates with poor histories - like ITT and the others from from the 1960s boom - but there are also some examples of genuine value creation.