
October's Pullback Has Investors Hunting For A Bottom
A big rally last Tuesday was met with selling pressure the remainder of the week and all but wiped out Tuesday’s gains. For the week, the Dow Jones Industrial Average (DJIA) index gained 0.4% and the S&P 500 rose fractionally, successfully snapping a three-week retreat while the Nasdaq (NDX) shed 0.6% to extend losses into a third week. Tech and small-cap stocks have been hit the hardest during this latest bout of market selling pressure that began with the commencement of the 4th Quarter. October has indeed been a scary month for equity investors thus far and this coming week may not prove to relieve investor anxiety.
Volatility Remains Elevated
Along with equities coming under pressure recently, volatility has been on the rise. The VIX finished just below 20 last week, down from 21+ in the previous week. A VIX around the 20 level is not market friendly and combined with the rather sizable SPX weekly expected move, investors and traders should expect what we saw from the market last week, somewhat mirrored in the coming week. To validate this forecast, we also turn to the Volatility of Volatility (VVIX) index which is presently well above 100.
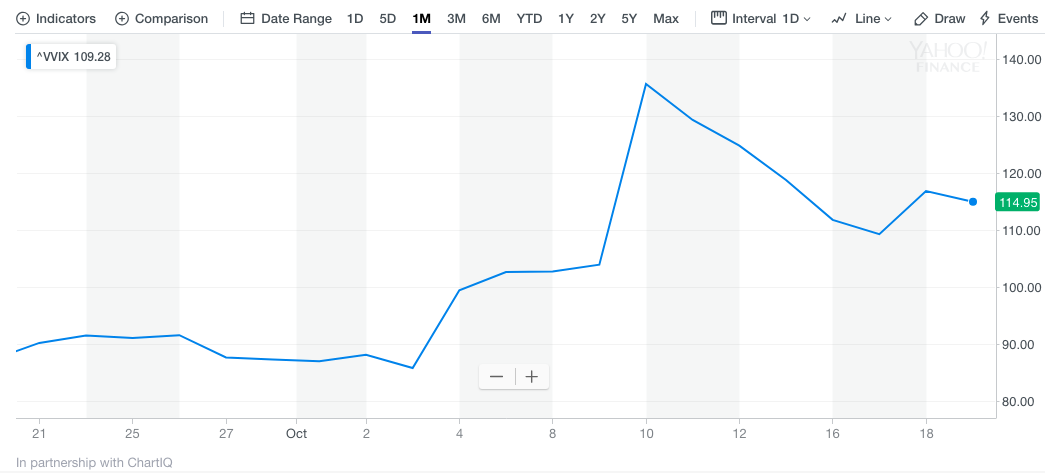
A reading above 100 tells us that hedge funds are buying OTM calls, pushing up VVIX as they hedge their greater equity exposure. For further validation of what may come in the week ahead let’s take a look at how hedge funds are positioned in VIX Futures.
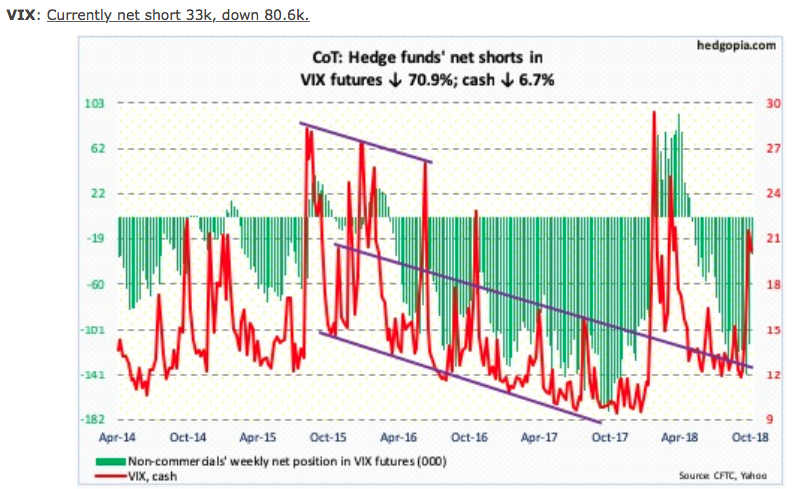
The biggest takeaway here is the net short VIX Futures position. The net short position has been reduced by some 80K contracts, suggesting hedge fund participants are expecting future bouts of higher volatility in the market. Collectively, the aforementioned variables align for rising volatility near-term, but a guarantee they are not.
As I mentioned before, this coming trading week’s expected move is rather large but lesser than that from the $71 expected move in the week that was.
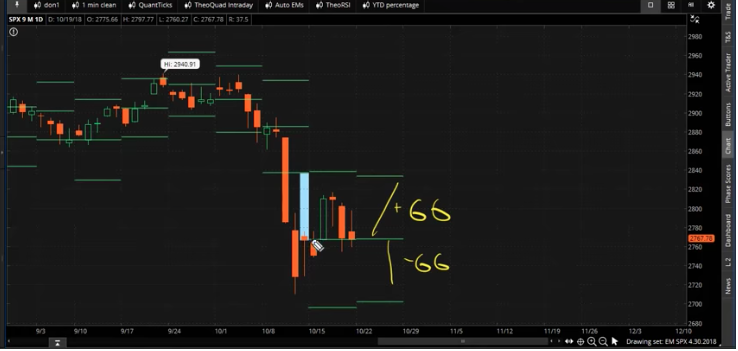
Although we came nowhere near achieving the expected move this past week, we fell within the expected move once again and after breaching the expected move in the week before and by a wide margin. This coming week’s expected move is $66, signaling heightened levels of volatility and fear in the market. Simply put, although earnings have been coming in better than expected, as they have in each of the prior 2 reporting periods for 2018, the selling pressure has persisted. We saw much of the same market activity during Q1 and at the onset of the Q2 reporting period. Shortly thereafter investors did bid up equities in each of the reporting periods, reflecting economic growth and corporate earnings growth. Has something changed, all of a sudden, or are we simply seeing the same pattern of market activity in the current earnings reporting season?
Bottoming Process
It’s difficult to forecast how close the market is from bottoming. There are a great many analysts and market watchers suggesting there is more room to the downside and a retest of the recent lows must be achieved before a Q4 rally can commence.
One thing to keep in mind as we continue to look for a near-term market bottom is the following: A market bottom is not just a bottom; it’s a bottoming process, as detailed further by Tony Dwyer of Canaccord Genuity.
“Over the past 60 years and through seven economic cycles, we have found that only a shutdown of credit availability has the power to generate a recession, which only takes place well after an inversion of the yield curve. While everyone is talking about this, the yield curve isn’t a sentiment indicator; it is a money availability indicator. Traditional and non-traditional banks alike lend money to make money, so why would a lender of any type lend money at a lower rate than it pays? As a result, while it “feels” like there is something wrong with our positive fundamental thesis given the decline in the economically sensitive areas of the market, similar to the other corrections throughout the 9.5-year bull market, we view the weakness as temporary until there are clear signs of a shut down in credit.”
Defining Variables of a Bottom
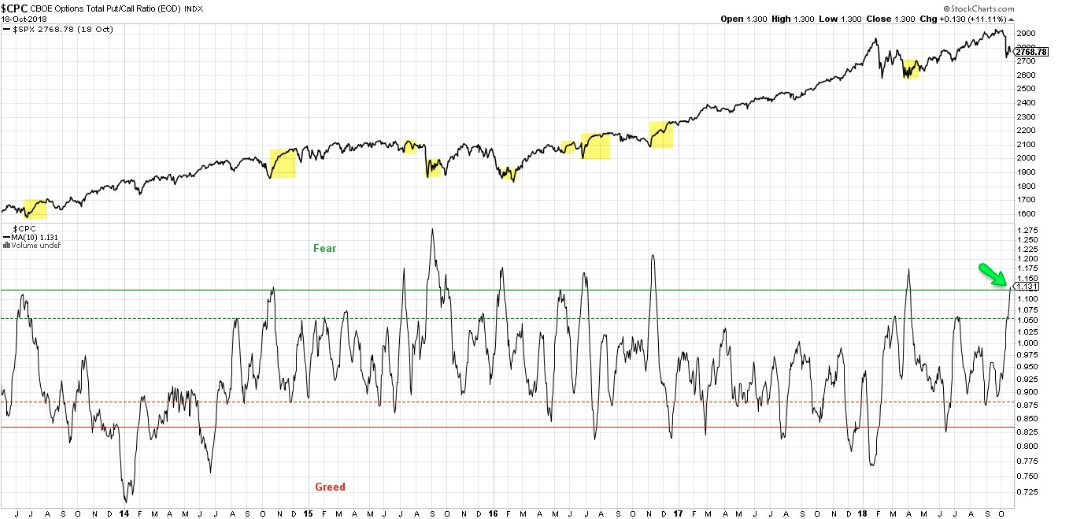
As it was with identifying the probability for heightened levels of volatility, we look for signs and variables to support our near-term bottom thesis. One such variable is the CBOE put/call ratio.
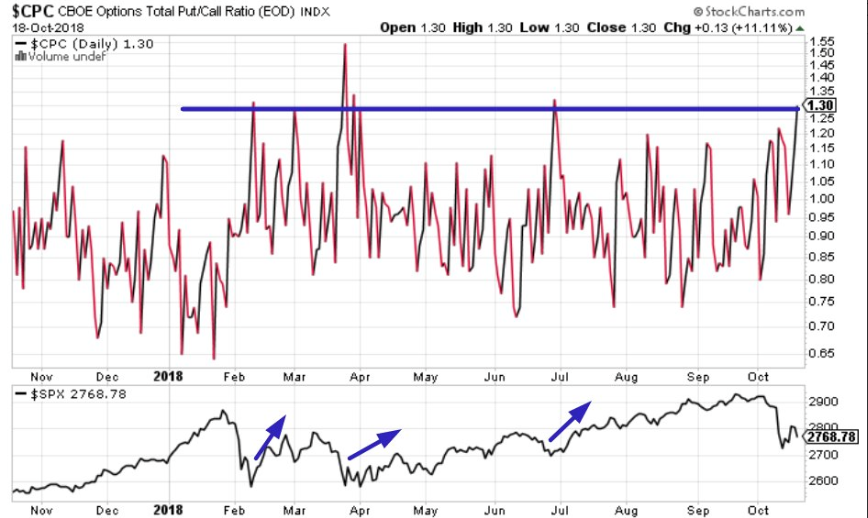
The put/call ratio was as high as 1.3 on Thursday. As indicated in the chart above, throughout 2018, such levels above 1 have created a near-term bottom for the S&P 500. It doesn’t mean that the ratio doesn’t have room to move higher in the coming week and as seen in April, but it has signaled that an S&P 500 bottom should be found in the coming week or so.
Of course, some of the other variables indicating a near-term market bottom are related to economic data performance. With that said, we’ll simply highlight one of the bigger and all-encompassing pieces of economic data from the prior week, the Leading Economic Indicators (LEI).
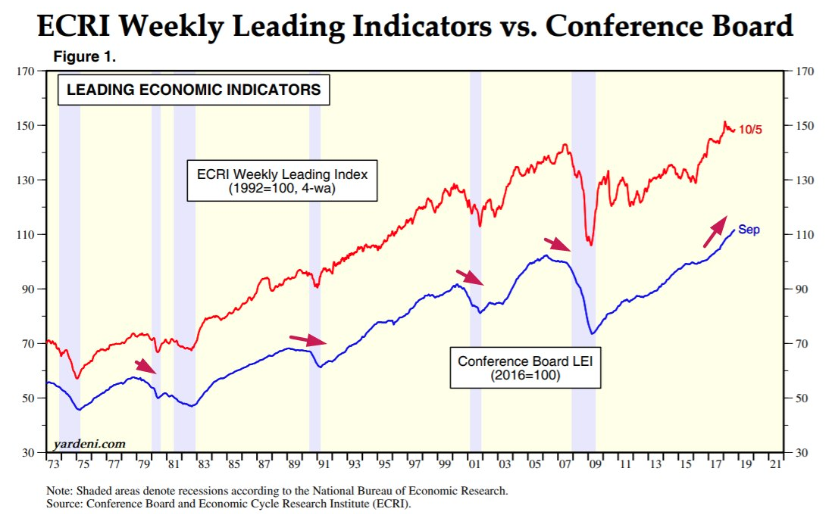
The Conference Board's Leading Economic Indicators continues to make new highs. Simply put, the economy is on strong footing and most of the economic data suggests the very same thing. From the unemployment data to consumer data, most aspects of the economy continue to grow at an accelerated pace from a year ago. As such, the economic data combined with certain market metrics signal the current equity market pullback is not only normal, but healthy and should abate near-term.
You have probably heard many suggest that when there is “blood in the water”, that’s where investors can best understand a bottom is being presented. We’ve not necessarily seen such a characterization of the current pullback yet, but we’ll see if we get there this coming week. Nonetheless, the sentiment for U.S. equities has greatly decreased over the last couple of weeks as determined in the AAII Investor Sentiment Survey.
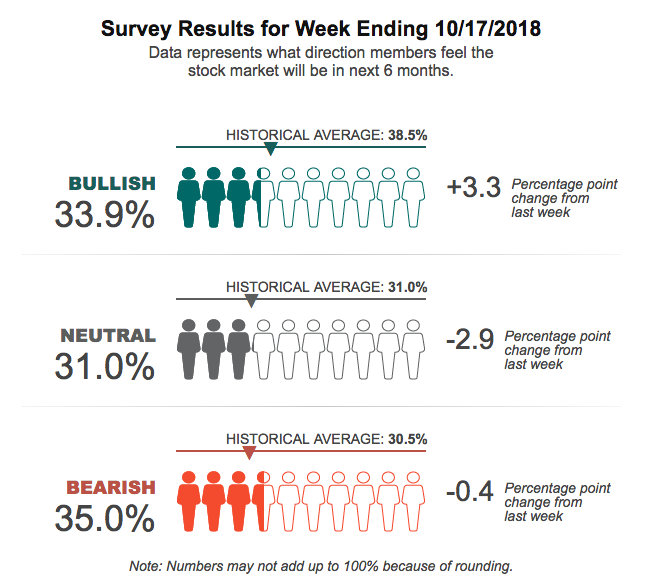
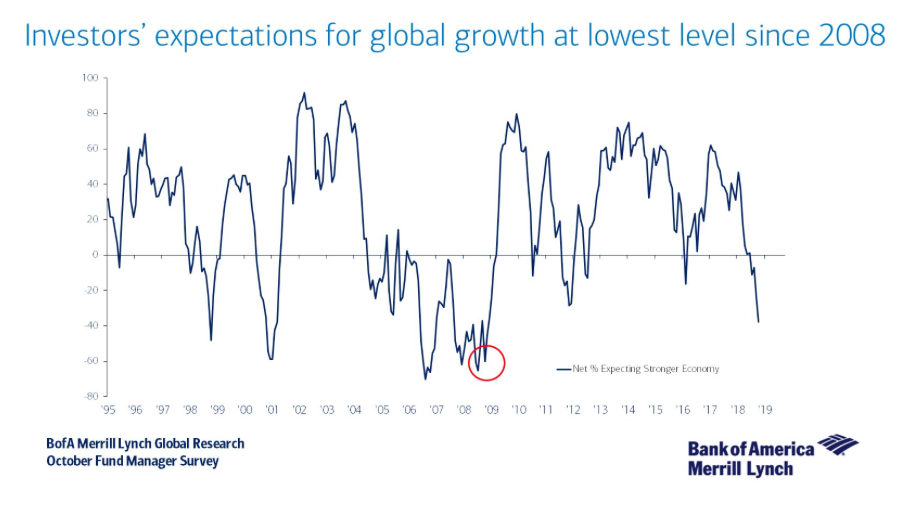
For the second consecutive week, more than a third of survey respondents say they are pessimistic about the short-term direction of stocks. Now we know that this sounds like a net negative for equities near-term, but as a contrarian indicator, negative sentiment is what bullish investors desire to see the most. Sentiment indicators are often used as contrarian indicators and if the AAII Sentiment Survey isn’t bearish enough, take a look at the most recent Bank of America Merrill Lynch survey on global growth expectations.
That brings us to one last set of statistical facts that suggest a near-term bottom is forthcoming. Jeffrey Hirsch, editor of The Stock Trader’s Almanac, points out that October for the Dow Jones Industrial Average has been up an average of 0.70% since 1950. With an average return of 0.07%, September is the worst month, and August, up 0.20%, the month with the second-lowest average DJIA return. Despite horrific happenings in 1929, 1987 and 2008, October is more of a bear-killer than a bull trap. Hirsch’s father, Yale Hirsch, started writing about the “best six months” strategy in 1986, noting how the November-through-April period had delivered the majority of the market’s gains, while the May-through-October period was a net drag on returns. The favorable seasonality beginning in two weeks is one of the reasons Steve Todd of Todd Market Forecast is bullish on stocks, noting the extremes of pessimism and bearishness in headlines and in the options markets, where put-buyers have scrambled for protection.
“The 10-day moving average of the CBOE put call ratio is very high and bullish,” writes Todd. “This chart tells me that we have weeks and perhaps months on the upside, and it looks like it will coincide with favorable seasonality, which officially begins in November.”
Last, but certainly not least, let’s take a look at what a recent Poll from Barron’s indicates about the future prospects for U.S. equity markets. Based on the findings of Barron’s fall Big Money Poll, 56% of professional investors are bullish on U.S. equities through next June, little changed from 55% in Barron's spring 2018 survey.
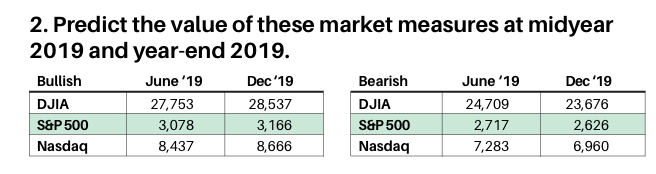
What’s more, the bulls see solid gains ahead for stocks. Their mean predictions put the S&P 500 index at 3078 by the middle of next year, and 3166 by the end of 2019, reflecting increases of 10% and 13%, respectively, from a recent 2800. While the Big Money Poll was taken just before the market’s sell-off in October, most managers interviewed by Barron’s say the sell-off is part of a normal correction.
“The U.S. economic outlook still looks pretty good,” says Scott Horsburgh, president of Provident Investment Management in Novi, Mich. “Corporate earnings continue to grow nicely, and [stock] valuations aren’t out of line.”
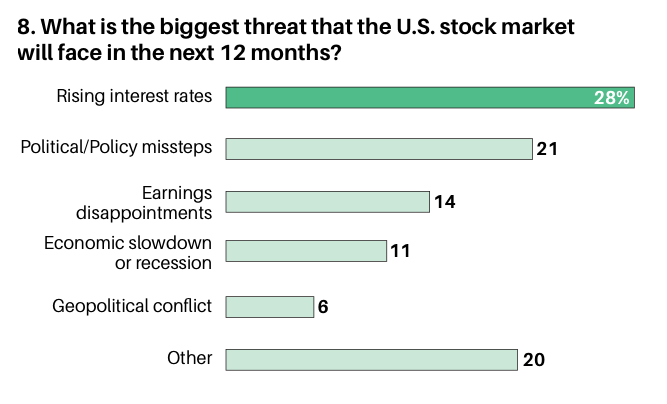
In terms of what asset managers see as the biggest threat to the stock market out into 2019, the following chart indicates that interest rates are the greatest threat.
I can’t stress enough that both the economic outlook and corporate earnings outlook remain rather robust. These generally prove to provide a tailwind for equity prices. Having said that, I do recognize there remain headwinds for which investor sentiment will continue to climb that wall of worry.
Q3 Earnings in Focus
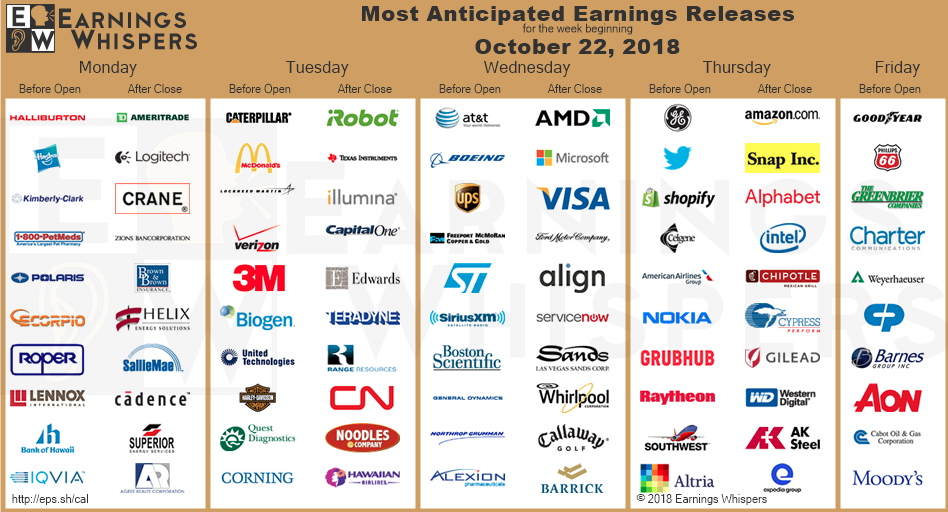
Here we are approaching the height of earnings season and in the midst of a market pullback that has the potential to retest recent lows. Let’s take a look at what the Q3 2018 earnings period has delivered thus far, keeping in mind that this week some 154 S&P 500 members will report results. Here is a graphic of some of those key reports due out this week with Thursday being a big tech-reporting day.
We now have Q3 results from 84 S&P 500 companies or 16.8% of the index’s total membership. Total earnings for these 84 companies are up 19.2% from the same period last year on 8.4% higher revenues, with 82.1% beating EPS estimates and 61.9% beating revenue estimates. The proportion of these companies beating both EPS and revenue estimates is 54.8 percent. According to FactSet, combining the actual results for the 84 companies with estimates for the still-to-come 416 index members, total S&P 500 earnings are expected to be up +19.2% from the same period last year on +7.2% higher revenues. For EPS, this forecast is up by a tenth of a percent on a week-2-week basis and likely to trend higher as we move through earnings season. Now let’s take a look at the updated Q3 2018 S&P 500 forecast from Thomson Reuters.
S&P 500 Aggregate Estimates and Revisions
- Third quarter earnings are expected to increase 21.9% from Q3 2017. Excluding the energy sector, the earnings growth estimate declines to 19.0%.
- Of the 84 companies in the S&P 500 that have reported earnings to date for Q3 2018, 84.3% have reported earnings above analyst expectations. This is above the long-term average of 64% and above the prior four quarter average of 77%
- The Q3 2018 blended revenue growth estimate is 7.4%. Excluding the energy sector, the revenue growth estimate declines to 6.4%.
- 6% of companies have reported Q3 2018 revenue above analyst expectations. This is above the long-term average of 60% and below with the prior four quarter average of 73%.
Thomson Reuters has consistently delivered more reliable forecasting historically than has FactSet, although we think it is optimal to follow both data-tracking firms. With that said, the headline in the updated forecast for earnings by Thomson Reuters shows a half percentage point increase in their earnings forecast for the Q3 2018 period versus the prior week's forecast. Again, we expect this forecast to continue to rise through earnings season and possible end with Q3 2018 earnings edging closer to 23% YOY growth.
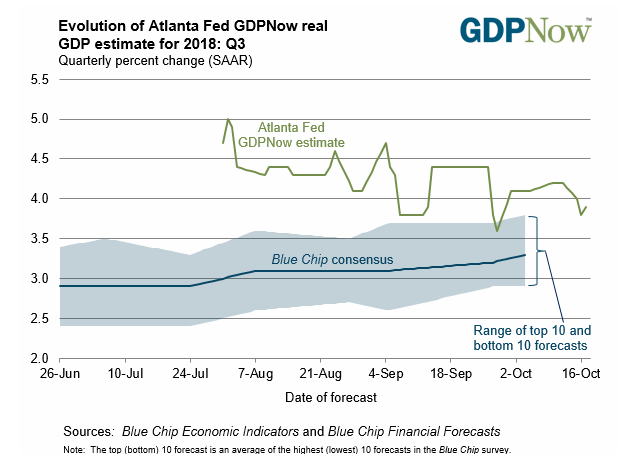
Q3 GDP This Week
Heading into the trading week, investors can look for several key economic data reports. More housing data and the Fed’s Beige book will underscore the biggest report of the week due out on Friday. All eyes will be on the Friday 8:30 a.m. EST release of GDP. In Q2, GDP rose 4.2% and expectations have been tampered lately for the Q3 result.
According to the Atlanta Fed, the GDPNow model estimate for real GDP growth (seasonally adjusted annual rate) in the third quarter of 2018 is 3.9% on October 17, down from 4.0% on October 15. On October 16, the nowcast of third-quarter real government expenditures growth fell from 2.1% to 1.3% after the U.S. Department of the Treasury and its Bureau of the Fiscal Service released the Monthly Treasury Statement during the afternoon of the previous day.


I think we have already seen a bottom for this dip and a base is being built here at the low. That said, i think there will still be rotation out of no growth stocks, stocks that run cash flow negative, and stocks that don't generate a profit. In the end, that is good and will enable the market to run more without crashing. The market is a bit misleading because many of the bad companies have been dropped out of the indexes or bought out leaving the better companies. There is however, a growing amount of dot-comish profitless companies in the market now though.