Nvidia (NVDA) – New Buying Opportunity On The Horizon?
Nvidia Corporation (Nasdaq:NVDA) has grown to become a leader in manufacturing graphic processing units (GPU) for computer and gaming devices as well as Artificial Intelligence (AI). In the last two years, the American company benefited the most from the growth of cryptocurrency and artificial intelligence markets. However, back in October 2018, the stock made a major peak at $292 and started correcting to the downside loosing more than 50% of its value in 2 months.
Nvidia stock wasn’t the only one being hit in recent decline as it’s direct competitor, Advanced Micro Devices (Nasdaq:AMD), suffered a 45% decline in October among other Technology and Semiconductor stocks around the world. Market sentiment started to switch as many investors considered the move to be just the the first leg of a bear market but is that really the case? It could be or the current decline could end all the correction and start another major rally into new all time highs. We do understand that long-term investors take positions based on fundamentals analysis such as the company’s competitive environment, corporate strategy, management, products, earnings outlook, valuation and/or balance sheet but technical analysis can highlight high probability inflection areas in the market which can act as a great entry points regardless of whether you are a trader looking to hold the stock for a few weeks to a few months or an investor looking for to hold the stock from a few months to a few years. I will present the technical picture based in Elliott Wave and highlight the next inflection area in the stock.
Based on the Elliott Wave Theory, NVDA has been in a bullish trend since IPO low in 1999 and the stock advanced in an impulsive 5 waves move. The multi-year rally finally ended last month representing the Grand Super Cycle wave ((I)) which triggered the current decline taking place in wave ((II)). According to Elliott Wave Theory, when a 5 wave impulse ends, there will be a correction caused by buyers taking profits.
Corrections can take many different forms and in this case correction appears to be taking the form of a double three structure which has a measured move target at $105.54. It is the 100% Fibonacci extension of the decline from $292 high to $176 low projected lower from $222 peak. So, we can see a final leg lower into the measured move target area before Christmas followed by a significant EOY rally. If we do get the final leg lower and the subsequent rally turns out to be the start of a move to a new all time high, then it would be a great opportunity to be able to catch such type of a move. Alternatively, it could produce a bounce toward 50 – 61.8 Fibonacci retracement area of the decline from the $222 peak.
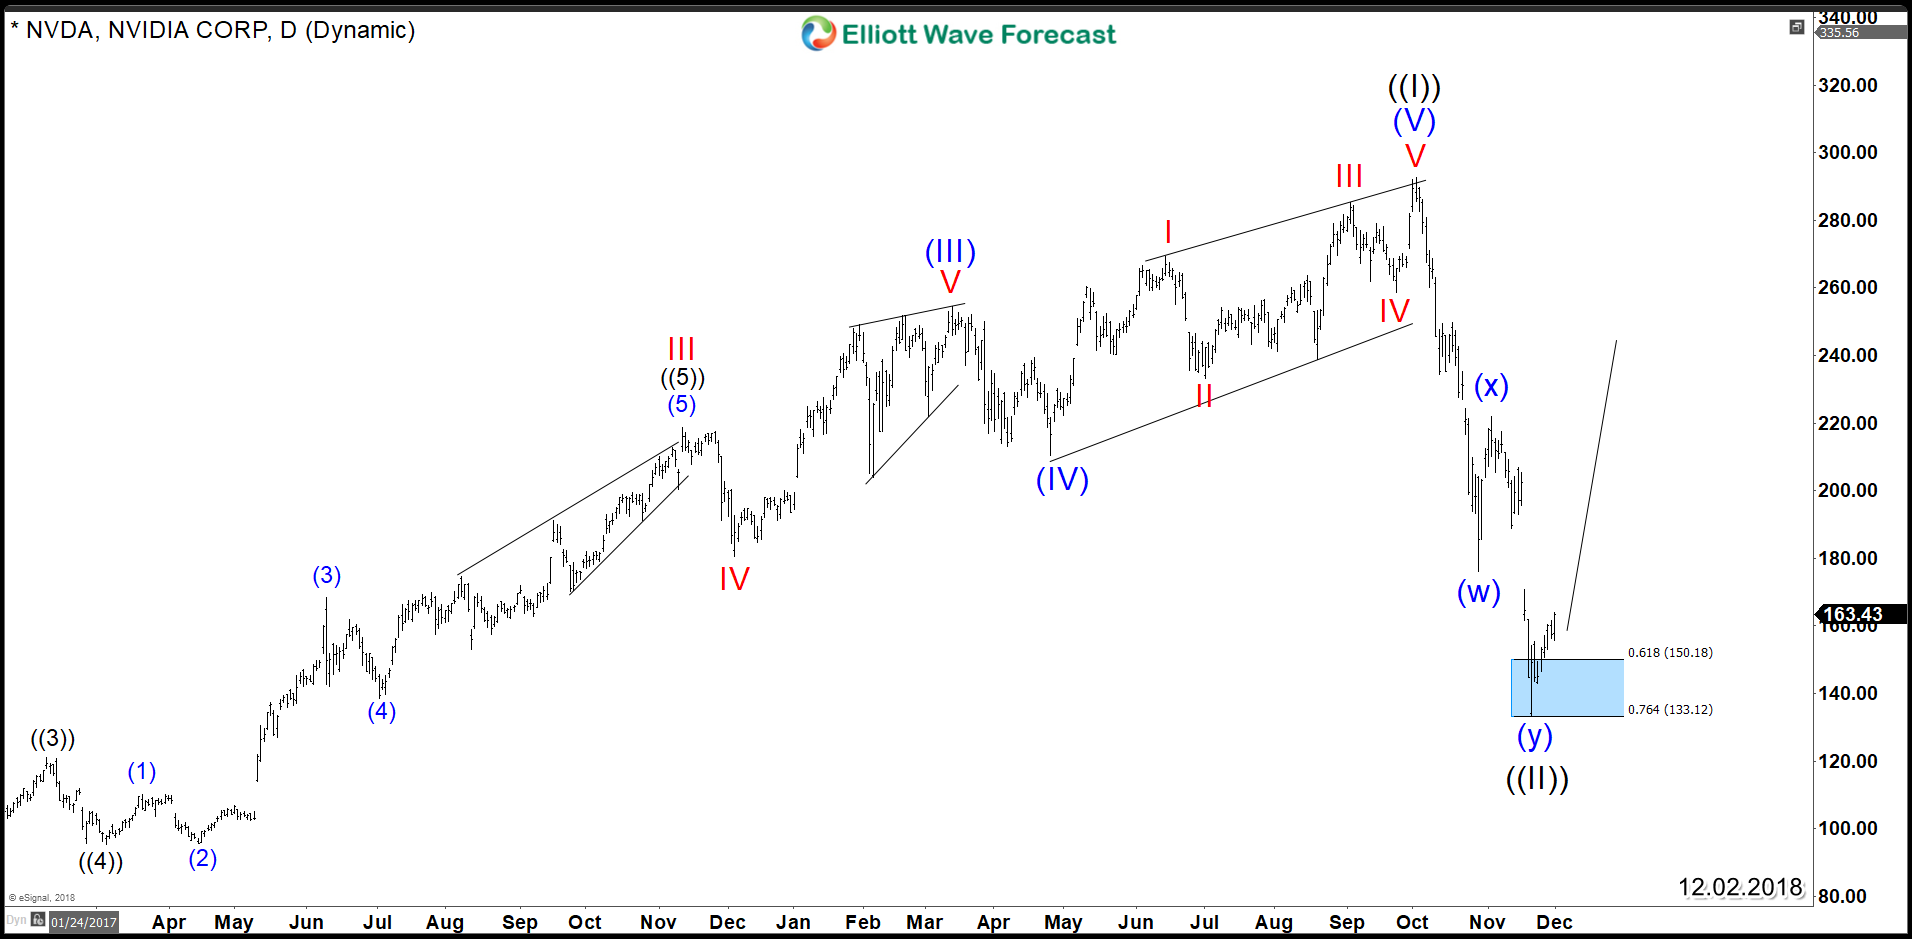
However at this stage, Nvidia stock is reacting higher from the 61.8 Fibonacci extension area$150 – $133 and there is high chance of the correction already ended at 11/20/2018 low. The idea is supported by the fact that Semiconductor ETF SMH and Advanced Micro Device AMD both reached their respective 100% extension ( Buying Area ) so consequently the sector is ready to resume the rally higher or bounce in larger 3 waves at least.
Nvidia NVDA Daily Chart 12-02-2018