
New Stocks On Most Attractive And Most Dangerous Lists: July 2016
Recap from June Picks
Our Most Attractive Stocks (-3.7%) underperformed the S&P 500 (-0.8%) last month. Most Attractive Large Cap stock The Macerich Company (MAC) gained 12% and Most Attractive Small Cap stock Children’s Place (PLCE) was up 11%. Overall, 14 out of the 40 Most Attractive stocks outperformed the S&P 500 in June.
Our Most Dangerous Stocks (-3.4%) outperformed the S&P 500 (-0.8%) last month. Most Dangerous Large Cap stock Penske Automotive Group (PAG) fell by 25% and Most Dangerous Small Cap Stock Marchex (MCHX) fell by 12%. Overall, 23 out of the 40 Most Dangerous stocks outperformed the S&P 500 in June.
Photo Credit: Got Credit (Flickr)
The successes of the Most Attractive and Most Dangerous stocks highlight the value of our forensic accounting as featured in Barron’s. Being a true value investor is an increasingly difficult, if not impossible, task considering the amount of data contained in the ever-longer annual reports. By analyzing key details in these SEC filings, our research protects investors’ portfolios and allows our clients to execute value-investing strategies with more confidence and integrity.
12 new stocks make our Most Attractive list this month and 12 new stocks fall onto the Most Dangerous list this month. July’s Most Attractive and Most Dangerous stocks were made available to members on July 7, 2016.
Our Most Attractive stocks have high and rising return on invested capital (ROIC) and low price to economic book value ratios. Most Dangerous stocks have misleading earnings and long growth appreciation periods implied by their market valuations.
Most Attractive Stock Feature for July: Syntel Inc. (SYNT: $47/share)
Syntel Inc. (SYNT), information technology and knowledge process outsourcing provider, is one of the additions to our Most Attractive stocks for July.
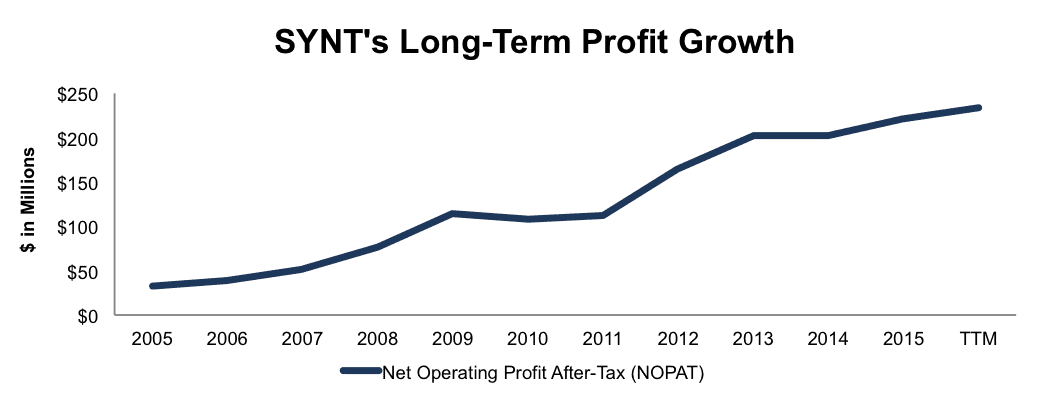
Syntel has built a highly profitable business by providing outsourced IT services and knowledge process outsourcing to companies across the globe. Over the past decade, Syntel has grown after-tax profit (NOPAT) by an impressive 21% compounded annually to $221 million. NOPAT has increased to $233 million over the last twelve months, per Figure 1.
Figure 1: Syntel’s NOPAT Growth
(Click on image to enlarge)
Sources: New Constructs, LLC and company filings
Every year since 1998, Syntel has earned a return on invested capital (ROIC) above 30% and currently earns a top-quintile 42% ROIC. Additionally, Syntel’s NOPAT margin has improved from 14% in 2005 to 24% over the last twelve months.
Impacts of Footnotes Adjustments And Forensic Accounting
In order to derive the true recurring cash flows, an accurate invested capital, and an accurate shareholder value, we made the following adjustments to Syntel’s 2015 10-K:
Income Statement: we made $55 million of adjustments, with a net effect of removing $31 million in non-operating income (3% of revenue). We removed $31 million in non-operating income and $12 million in non-operating expenses. You can see all the adjustments made to SYNT’s income statement here.
Balance Sheet: we made $1.5 billion of adjustments to calculate invested capital with a net decrease of $683 million. One of the largest adjustments was $236 million due to other comprehensive income. This adjustment represented 20% of reported net assets. You can see all the adjustments made to SYNT’s balance sheet here.
Valuation: we made $1.2 billion of adjustments with a net effect of increasing shareholder value by $900 million. The largest adjustment was the inclusion of $1.1 billion in excess cash. This adjustment represents 27% of Syntel’s market cap.
Current Valuation Implies No Profit Growth
SYNT has marginally outpaced the broader market and is up 5% year-to-date (compared to 4.5% S&P 500). However, at its current valuation, SYNT is significantly undervalued and currently has a price-to-economic book value (PEBV) ratio of 1.0. This ratio means that the market expects SYNT’s NOPAT to never meaningfully increase from its current levels. This expectation seems rather pessimistic given the past decade of profit growth. If Syntel can grow NOPAT by just 6% compounded annually for the next decade, the stock is worth $65/share today – a 38% upside.
Most Dangerous Stock Feature: Acadia Healthcare (ACHC: $54/share)
Acadia Healthcare (ACHC), rehabilitation center provider, is one of the additions to our Most Dangerous stocks for July.
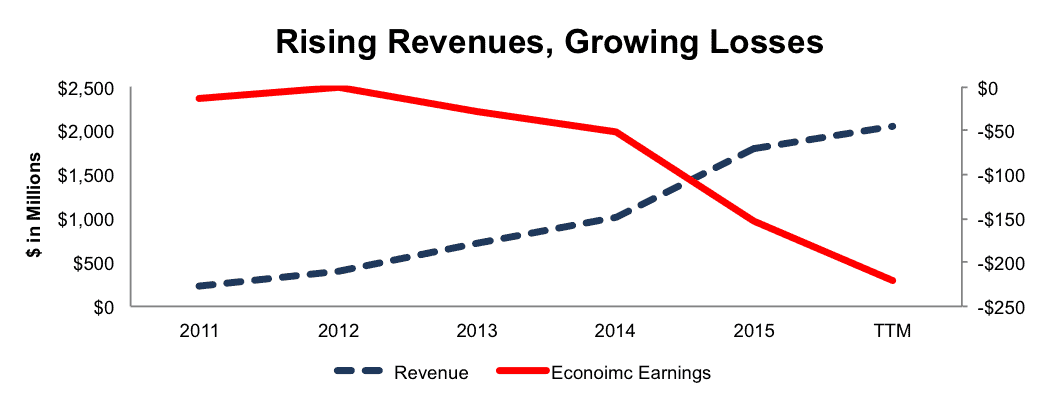
ACHC has grown revenue by an astonishing 69% compounded annually from 2011-2015. Over this time, Acadia’s economic earnings, the true cash flows of the business have declined from -$13 million to -$153 million. Over the last twelve months, economic earnings have fallen even further to -$221 million, per Figure 2.
Figure 2: ACHC’s Increasingly Negative Economic Earnings
(Click on image to enlarge)
Sources: New Constructs, LLC and company filings
In addition to increasing losses, Acadia’s ROIC has been persistently low, and the company currently earns a bottom-quintile 5% ROIC as of the last twelve months. Further compounding the poor fundamentals, the company has burned through a cumulative -$3.4 billion in free cash flow since 2012.
Forensic Accounting Reveals Overstated EPS
In order to derive the true recurring cash flows, an accurate invested capital, and a real shareholder value, we made the following adjustments to Acadia Healthcare’s 2015 10-K:
Income Statement: we made $225 million of adjustments with a net impact of removing $104 million in non-operating expenses (6% of revenue). We removed $165 million in non-operating expenses and $60 million in non-operating income. You can see all the adjustments made to ACHC’s income statement here.
Balance Sheet: we made $1.2 billion of adjustments to calculate invested capital with a net decrease of $36 million. The largest adjustment was $579 million related to midyear adjustments. This adjustment represented 15% of reported net assets. You can see all the adjustments made to ACHC’s balance sheet here.
Valuation: we made $3.8 billion of adjustments with a net effect of decreasing shareholder value by $3.8 billion. There were no adjustments that increased shareholder value. The largest adjustment was the removal of $3.8 billion in total debt, which includes $123 million in off balance sheet debt. This adjustment represents 80% of Acadia’s market cap.
Overly Optimistic Expectations Baked Into Valuation
Despite the clear breakdown in fundamentals, ACHC is priced for significant profit growth in the future. To justify it’s current price of $54/share, ACHC must grow NOPAT (and free cash flow) by 14% compounded annually for the next 12 years. In this scenario, we conservatively assume ACHC can grow NOPAT without any spending on working capital or fixed assets, which is unlikely, but allows us to create a best-case scenario. For reference, ACHC’s invested capital has grown on average $968 million (54% of 2015 revenue) each year since 2012.
On the other hand, even if ACHC can grow NOPAT by 12% compounded annually for the next decade, the stock is worth only $30/share today – a 44% downside.
Disclosure: New Construct Staff receive no compensation to write about any specific stock, sector or theme.


