
New Stocks On Exec Comp & ROIC Model Portfolio: June 2017
Our Exec Comp Aligned With ROIC Model Portfolio (+1.4%) underperformed the S&P 500 (+3.5%) last month. The best performing stock in the portfolio was Hasbro Inc. (HAS), which was up 11%. Overall, four out of the 15 Exec Comp Aligned With ROIC Stocks outperformed the S&P in May and 11 had positive returns.
Since inception, this model portfolio is up 24% while the S&P 500 is up 18%.
The success of this Model Portfolio highlights the value of our Robo-Analyst technology, which scales our forensic accounting expertise (featured in Barron’s) across thousands of stocks.
This Model Portfolio only includes stocks that earn an Attractive or Very Attractive rating and align executive compensation with improving ROIC. We think this combination provides a uniquely well-screened list of long ideas because return on invested capital (ROIC) is the primary driver of shareholder value creation.
New Stock Feature for June: O’Reilly Automotive (ORLY: $230/share)
O’Reilly Automotive (ORLYORLY), an automotive aftermarket parts retailer, is one of the additions to our Exec Comp Aligned With ROIC Model Portfolio in June.
Over the past decade, O’Reilly has grown revenue by 14% compounded annually. Over the same time, the company has grown after-tax profit (NOPAT) by 19% compounded annually to $1.1 billion in 2016. The accelerated NOPAT growth rate can be attributed to O’Reilly’s rising NOPAT margin. Per Figure 1, NOPAT margin has improved from 9% in 2006 to 13% over the last twelve months (TTM).
Figure 1: O’Reilly’s Decade of Profit Growth
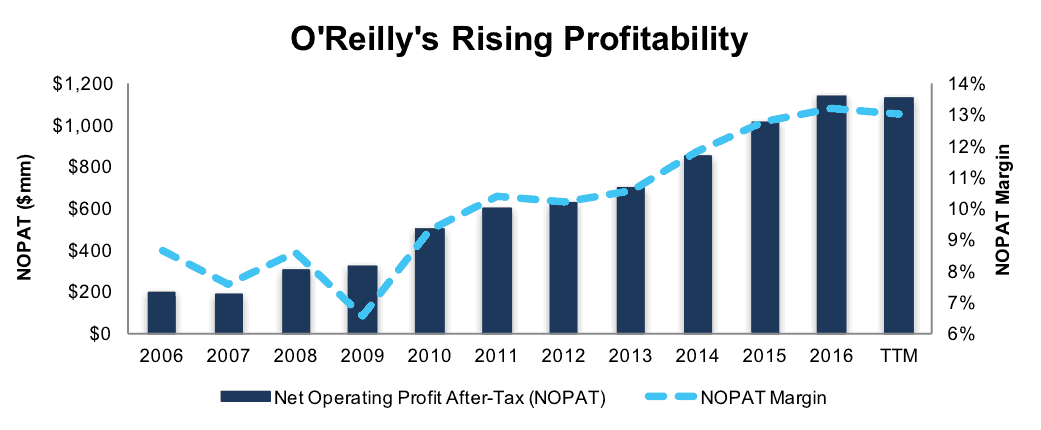
Sources: New Constructs, LLC and company filings
O’Reilly currently earns a top-quintile 20% return on invested capital (ROIC) and has generated a cumulative $4 billion (19% of market cap) in free cash flow (FCF) over the past five years. O’Reilly’s $1.2 billion in FCF over the last twelve months equates to a 5% FCF yield.
Executive Compensation Plan Incentivizes Shareholder Value Creation
O’Reilly has aligned executive compensation with ROIC since 2013, when it replaced inventory turnover as a performance metric. In 2016, 20% of annual incentive compensation awards were based on ROIC. Incentive compensation represents around 40% of an executive’s compensation package.
The focus on ROIC helps ensure executives are good stewards of capital. Per Figure 2, O’Reilly has improved its ROIC from 7% in 2009 to 20% TTM.
Figure 2: Improving ROIC Improves Shareholder Value
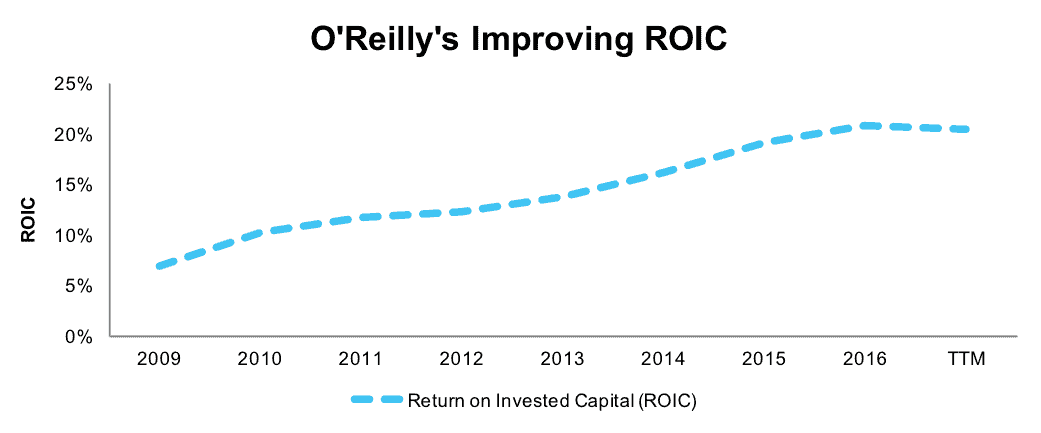
Sources: New Constructs, LLC and company filings
We’ve detailed ways in which ROIC is directly correlated to changes in shareholder value here. ORLY’s use of return on invested capital to measure performance ensures executives’ interests are aligned with shareholders’ interests.
Price Decline Leaves ORLY Undervalued
Over the past year ORLY is down nearly 15% while the S&P is up 17%. This price depreciation amidst improving fundamentals leaves ORLY undervalued.
At its current price of $230/share, ORLY has a price-to-economic book value (PEBV) ratio of 1.2. This ratio means the market expects ORLY’s NOPAT to only grow by 20% from current levels. This expectation seems to ignore O’Reilly has grown NOPAT by 19% compounded annually since 2006.
If O’Reilly can maintain current NOPAT margins (13%) and grow NOPAT by just 5% compounded annually for the next decade, the stock is worth $306/share today – a 33% upside.
Impacts of Footnotes Adjustments and Forensic Accounting
Our Robo-Analyst technology enables us to perform forensic accounting with scale and provide the research needed to fulfill fiduciary duties. In order to derive the true recurring cash flows, an accurate invested capital, and a real shareholder value, we made the following adjustments to O’Reilly’s 2016 10-K:
Income Statement: we made $220 million of adjustments, with a net effect of removing $99 million in non-operating expense (1% of revenue). We removed $61 million in non-operating income and $159 million in non-operating expenses. You can see all the adjustments made to ORLY’s income statement here.
Balance Sheet: we made $1.9 billion of adjustments to calculate invested capital with a net increase of $1.6 billion. One of the largest adjustments was $1.7 billion due to operating leases. This adjustment represented 46% of reported net assets. You can see all the adjustments made to ORLY’s balance sheet here.
Valuation: we made $4.1 billion of adjustments with a net effect of decreasing shareholder value by $4.1 billion. There were no adjustments that increased shareholder value. Apart from total debt, which includes the operating leases noted above, one of the largest adjustments to shareholder value was $231 million in outstanding employee stock options. This adjustment represents 1% of ORLY’s market cap. Despite the net decrease in shareholder value, ORLY remains undervalued.
Disclosure: David Trainer, Kyle Guske II, and Kenneth James receive no compensation to write about any specific stock, style, or theme.


