
Nasdaq Reports Fourth Quarter And Full Year 2017 Results; Delivers Strong Revenue And Income Growth
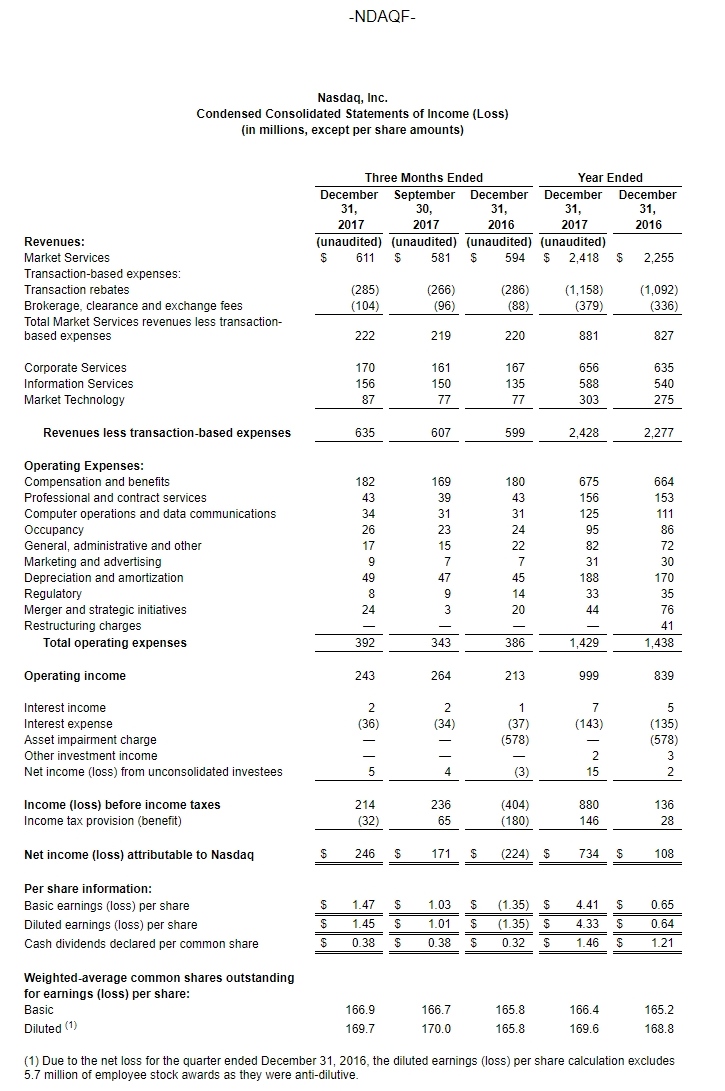
- 2017 net revenues1 were $2,428 million, an increase of 7% compared to 2016. Subscription and recurring revenues2 increased 7% in 2017 compared to the prior year, and represented 76% of total net revenues.
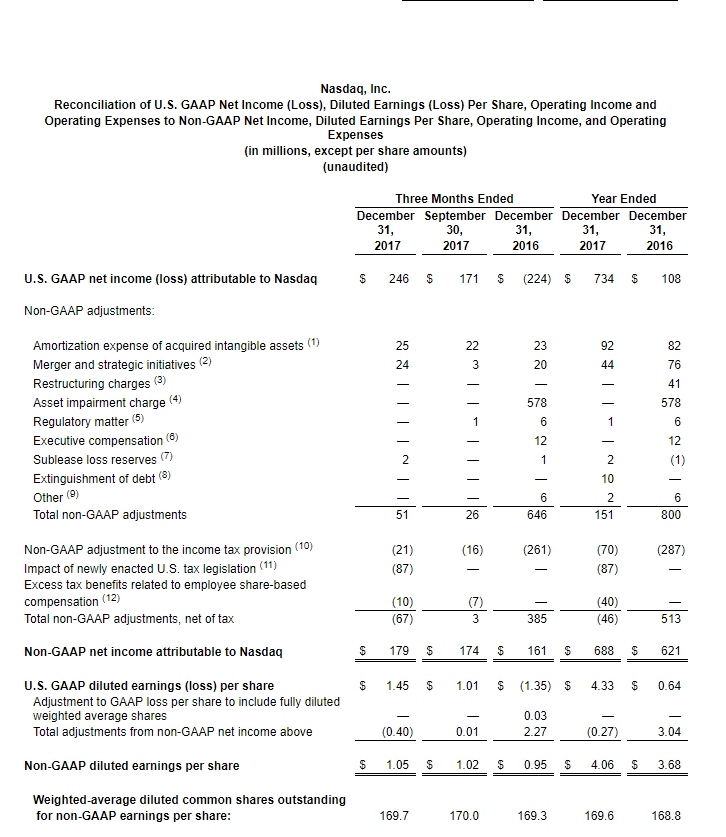
- 2017 GAAP diluted EPS was $4.33, compared to $0.64 in 2016, while 2017 non-GAAP diluted EPS3 was $4.06, a 10% increase compared to the prior year.
- Fourth quarter 2017 net revenues were $635 million, an increase of 6% compared to the fourth quarter of 2016. Subscription and recurring revenues increased 8% in the fourth quarter compared to prior year period.
- Fourth quarter 2017 GAAP diluted EPS was $1.45 compared to a loss of $1.35 in the fourth quarter of 2016, while non-GAAP diluted EPS was $1.05, the latter an increase of 11% from the fourth quarter of 2016.
- During 2017, the company returned $446 million to shareholders, including $243 million in dividends and $203 million in share repurchases, representing 61% of our GAAP net income and 65% of our non-GAAP net income in the period.
- The company achieved several milestones as it executes a strategic pivot to maximize opportunities as a technology and analytics partner, including closing the acquisition of eVestment on October 23, 2017, and announcing an agreement for the sale of the Public Relations Solutions and Digital Media Services businesses on January 29, 2018.
NEW YORK, Jan. 31, 2018 (GLOBE NEWSWIRE) -- Nasdaq, Inc. (Nasdaq: NDAQ) today reported financial results for the fourth quarter and full year of 2017.
2017 net revenues were $2,428 million, up $151 million, or 7%, from $2,277 million in the prior year period. The full year increase in net revenues included a $52 million increase due to organic growth, a $9 million favorable impact from changes in foreign exchange rates and a $90 million impact from acquisitions. Fourth quarter 2017 net revenues were $635 million, up $36 million, or 6%, from $599 million in the prior year period. The fourth quarter increase in net revenues included a $17 million, or 3%, increase due to organic growth, a $12 million favorable impact from changes in foreign exchange rates and a $7 million impact from acquisitions.
“We achieved strong results in the fourth quarter and full year of 2017 through an intense focus on our clients and strong execution against our business priorities," said Adena Friedman, President, and CEO, Nasdaq. "The acquisition of eVestment advanced our relationships with investment managers, the timely integration of ISE delivered benefits to our trading clients and our shareholders, our next generation markets platform opened new opportunities with our technology clients, and our advocacy has driven a deeper partnership with our corporate clients."
Mrs. Friedman continued, "We are building upon the success of 2017 by establishing three new execution priorities for 2018, including progressing our pivot to align with and maximize our opportunities as an innovative analytics and technology partner, developing and deploying our ‘markets economy’ technology strategy, and continuing to advance our competitive position in our core businesses. All of us at Nasdaq are aligned around these priorities and look forward to another productive year."
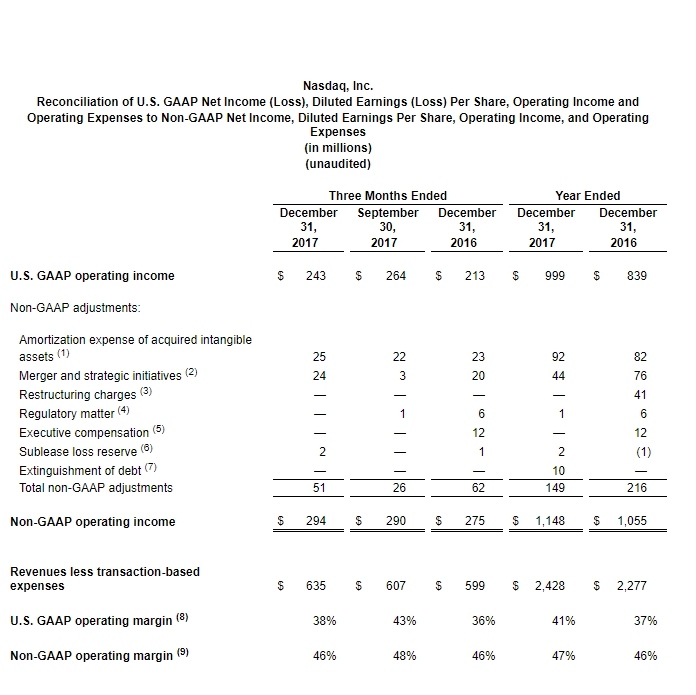
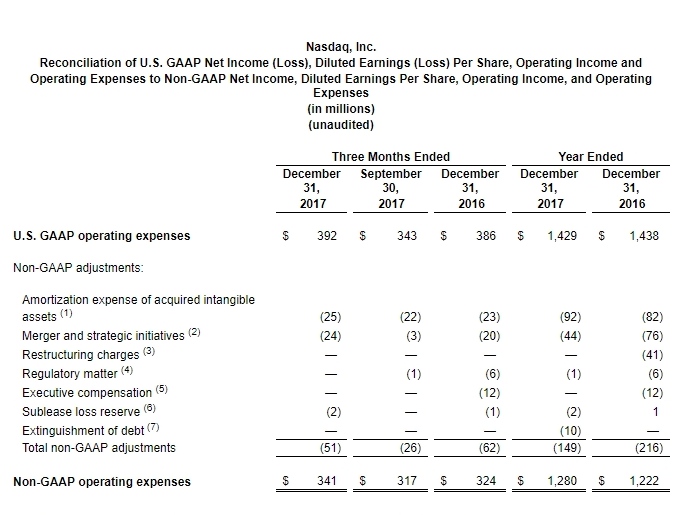
GAAP operating expenses were $392 million in the fourth quarter of 2017, an increase of $6 million from $386 million in the fourth quarter of 2016. The increase primarily reflects higher merger and strategic initiatives expense and depreciation and amortization expense, partially offset by lower regulatory expense.
Non-GAAP operating expenses were $341 million in the fourth quarter of 2017, an increase of $17 million, or 5%, compared to the fourth quarter of 2016. This reflects a $16 million increase from acquisitions and a $7 million unfavorable impact from changes in foreign exchange rates, partially offset by a $6 million organic expense decrease.
“In 2017, we successfully executed against our integration, efficiency and capital return plans, exceeding our initial $60 million synergy target related to the 2016 acquisitions, increasing our operating margin, and returning 65% of non-GAAP net income to shareholders through dividends and share repurchases," said Mr. Michael Ptasznik, Executive Vice President and Chief Financial Officer, Nasdaq.
Mr. Ptasznik continued, "To advance the strategic ambitions we've outlined in late 2017, we've deliberately reallocated resources, people and capital towards our largest growth opportunities, principally in the Market Technology and Information Services segments, which is expected to further enhance our ability to deliver on our double-digit total shareholder return target."
On a GAAP basis, net income for the fourth quarter of 2017 was $246 million, or $1.45 per diluted share, compared with a net loss of $224 million, or a loss of $1.35 per diluted share, in the fourth quarter of 2016. In the fourth quarter of 2017, we recorded a decrease to tax expense of $87 million to reflect the estimated impact associated with the enactment of the Tax Cuts & Jobs Act on December 22, 2017. The decrease in tax expense primarily relates to the remeasurement of our net U.S. deferred tax liability at the lower U.S. federal corporate income tax rate. The estimate may be refined in the future as new information becomes available.
On a non-GAAP basis, net income for the fourth quarter of 2017 was $179 million, or $1.05 per diluted share, compared with $161 million, or $0.95 per diluted share, in the fourth quarter of 2016. For the three months and year ended December 31, 2017, as well as going forward, non-GAAP diluted EPS will exclude any excess tax benefits or provisions related to employee share-based compensation.
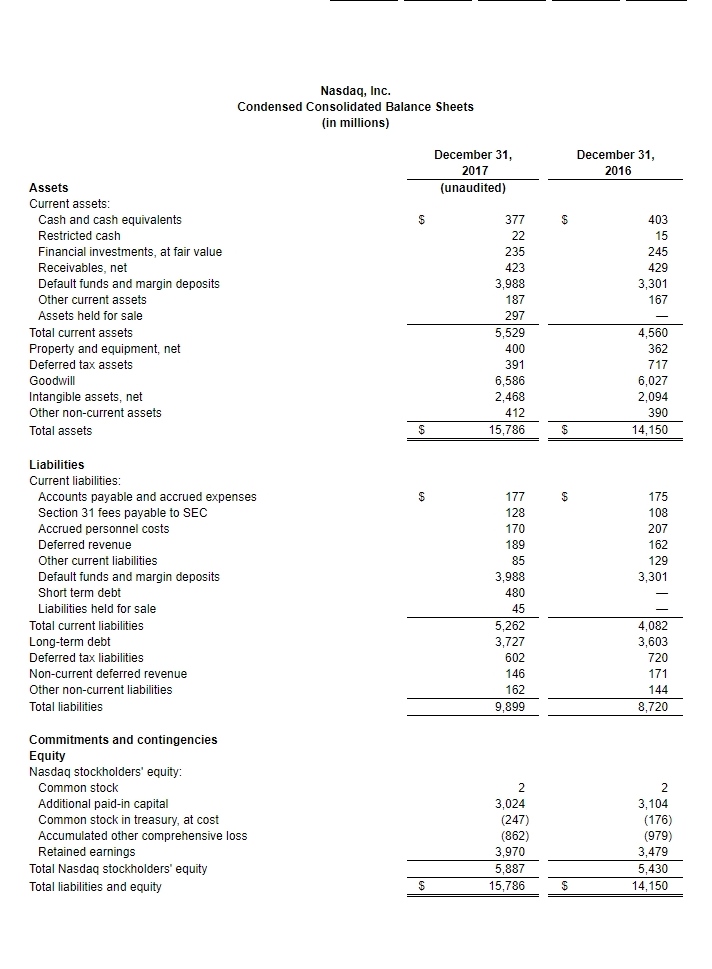
At December 31, 2017, the company had cash and cash equivalents of $377 million and total debt of $4,207 million, resulting in net debt of $3,830 million. This compares to net debt of $3,200 million at December 31, 2016. Share repurchases totaled $29 million during the fourth quarter of 2017.
As of December 31, 2017, there was $226 million remaining under the board authorized share repurchase program, and in January 2018, Nasdaq's board of directors added $500 million to the repurchase authorization, bringing the total capacity to $726 million.
INITIATING 2018 NON-GAAP EXPENSE AND TAX GUIDANCE4- The company expects 2018 non-GAAP operating expenses of $1,375 to $1,415 million. The guidance assumes a full year, or approximately $170 million, of expenses associated with the Public Relations Solutions and Digital Media Services businesses, which we have announced an agreement to sell. We will provide an update to the full year expense guidance after the transaction is closed. Nasdaq expects its 2018 non-GAAP tax rate to be in a range of 24.5% - 26.5%.
BUSINESS HIGHLIGHTS
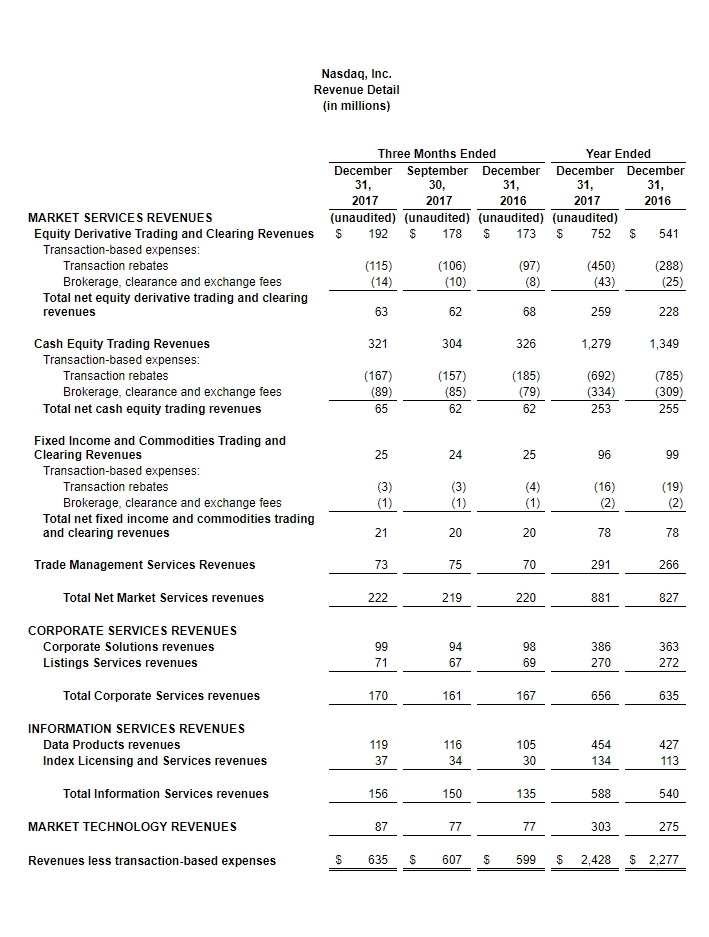
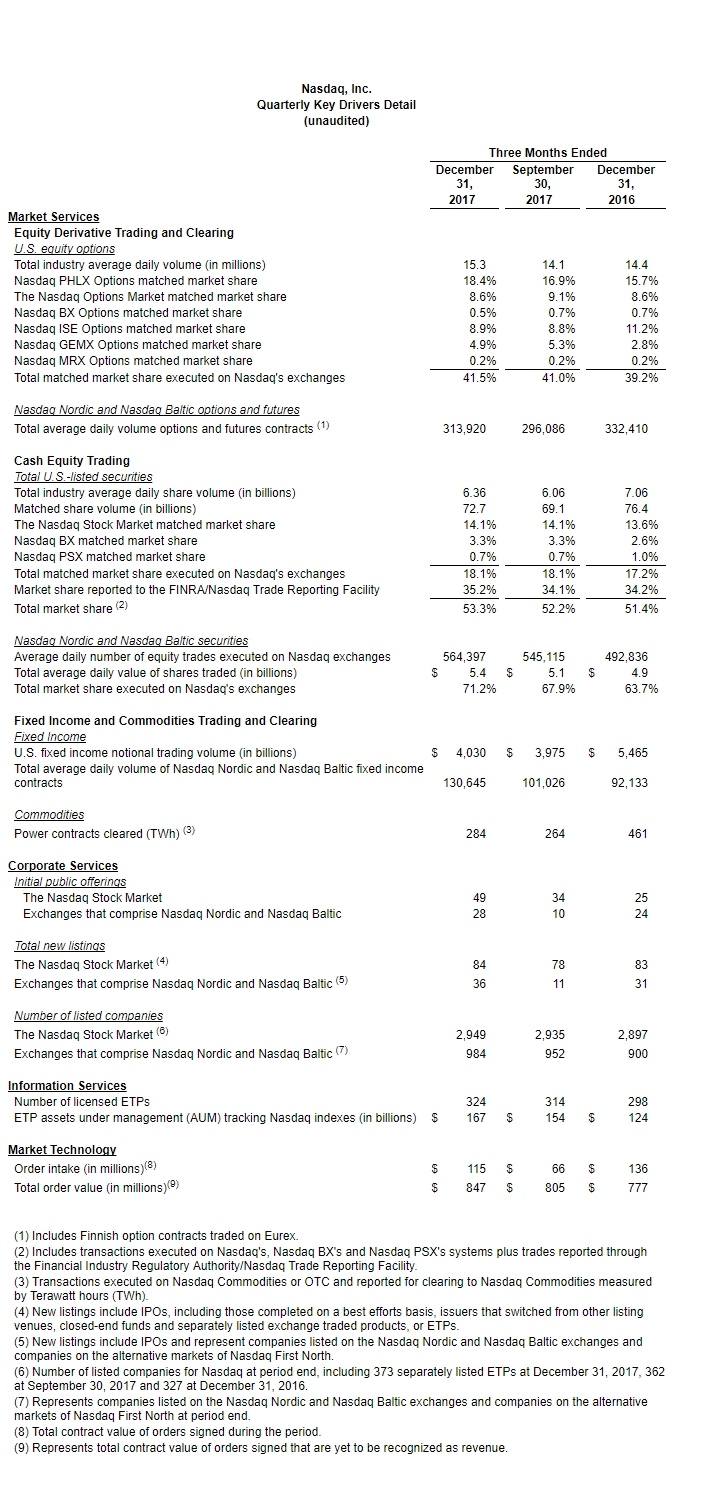
Market Services (35% of total net revenues) - Net revenues were $222 million in the fourth quarter of 2017, up $2 million when compared to the fourth quarter of 2016.
Equity Derivatives (10% of total net revenues) - Net equity derivative trading and clearing revenues were $63 million in the fourth quarter of 2017, down $5 million compared to the fourth quarter of 2016. The decrease primarily reflects lower net revenue capture, partially offset by higher U.S. industry trading volumes and higher U.S. market share.
Cash Equities (10% of total net revenues) - Net cash equity trading revenues were $65 million in the fourth quarter of 2017, up $3 million from the fourth quarter of 2016. This increase primarily reflects higher European cash equities revenues as well as a $2 million favorable impact from changes in foreign exchange rates.
Fixed Income and Commodities Trading and Clearing (3% of total net revenues) - Net fixed income and commodities trading and clearing revenues were $21 million in the fourth quarter of 2017, up $1 million from the fourth quarter of 2016, due to a favorable impact from changes in foreign exchange rates.
Trade Management Services (12% of total net revenues) - Trade management services revenues were $73 million in the fourth quarter of 2017, up $3 million compared to the fourth quarter of 2016, primarily due to an increase in customer demand for third-party connectivity and co-location, as well as a favorable impact from changes in foreign exchange rates.
Corporate Services (27% of total net revenues) - Revenues were $170 million in the fourth quarter of 2017, up $3 million compared to the fourth quarter of 2016.
Corporate Solutions (16% of total net revenues) - Corporate solutions revenues were $99 million in the fourth quarter of 2017, up $1 million from the fourth quarter of 2016 due to a favorable impact from changes in foreign exchange rates.
Listing Services (11% of total net revenues) - Listing services revenues were $71 million in the fourth quarter of 2017, up $2 million from the fourth quarter of 2016. The change reflects a $2 million favorable impact from changes in foreign exchange rates and an increase in European listings revenues, partially offset by a decrease in U.S. listings revenues due to the run-off of fees earned from listing of additional shares, resulting from client adoption of our all-inclusive annual listing fee program beginning in 2015.
Information Services (25% of total net revenues) - Revenues were $156 million in the fourth quarter of 2017, up $21 million from the fourth quarter of 2016.
Data Products (19% of total net revenues) - Data products revenues were $119 million in the fourth quarter of 2017, up $14 million compared to the fourth quarter of 2016, primarily due to a $7 million impact from acquisitions, net of an $11 million purchase price adjustment on deferred revenue associated with the closing of the eVestment acquisition, a $5 million organic growth impact and a $2 million favorable impact from changes in foreign exchange rates.
Index Licensing and Services (6% of total net revenues) - Index licensing and services revenues were $37 million in the fourth quarter of 2017, up $7 million from the fourth quarter of 2016 primarily due to higher assets under management in exchange traded products linked to Nasdaq indexes.
Market Technology (13% of total net revenues) - Revenues were $87 million in the fourth quarter of 2017, up $10 million from the fourth quarter of 2016. The increase primarily reflects organic growth of $8 million, primarily due to higher change request revenues and software as a service revenues, and a $2 million favorable impact from changes in foreign exchange rates. New order intake totaled $115 million in the fourth quarter of 2017 while the backlog reached a record $847 million at December 31, 2017, up 9% from December 31, 2016.
CORPORATE HIGHLIGHTS
- Nasdaq achieved several milestones related to the strategic pivot to maximize opportunities as a technology and analytics provider. On October 23, 2017, Nasdaq closed the acquisition of eVestment, an industry leading content and analytics provider used by asset managers, investment consultants and asset owners, which continued to experience strong revenue growth on a stand-alone basis while also driving significant year-over-year improvement in both new sales and client retention. On January 29, 2018, the company announced an agreement to sell its Public Relations Solutions and Digital Media Services businesses to West Corporation, who will partner with Nasdaq to continue to deliver certain products included in the transaction to eligible Nasdaq listing clients. The transaction is subject to regulatory approvals and customary closing conditions.
- Market Technology order intake totaled $292 million during 2017 while total order backlog set a new record of $847 million at December 31, 2017. Order intake totaled $292 million in 2017 including $115 million in the fourth quarter of 2017. New and expanded client relationships during the quarter included an agreement with the Saudi Stock Exchange (Tadawul) to deliver new cash and derivatives clearing, central securities depository (CSD) and post-trade risk management technologies, and an agreement with SIX Group for the provision of an index system. Nasdaq also signed a record six new exchange clients during 2017 across core trade matching, risk management and post trade systems, including BVP in Panama, STRATE (the South African CSD) and Astana International Exchange in Kazakhstan, while also experiencing growth in its SMARTS surveillance and BWise enterprise risk management businesses.
- Nasdaq saw strong growth and record ETP assets under management tracking Nasdaq indexes. Overall assets under management (AUM) in ETPs benchmarked to Nasdaq's proprietary index families increased to a record $167 billion as of December 31, 2017, up 35% compared to December 31, 2016. The December 31, 2017 total AUM included $70 billion, or 42%, tracking smart beta indexes. Also as of December 31, 2017, the number of ETPs tracking Nasdaq-licensed indexes rose to 324 compared to 298 at December 31, 2016.
- The Nasdaq Stock Market led U.S. exchanges for IPOs and saw a record number of Nordic new listings in 2017. In the U.S. market, The Nasdaq Stock Market welcomed 268 new listings during 2017, 136 of which were IPOs. Highlights from the fourth quarter included CarGurus, MongoDB, National Vision and Stitch Fix. The Nasdaq Stock Market won 63% of IPO listings in 2017 which represents the fifth consecutive year of leadership in IPOs. Nasdaq's Nordic, Baltic and First North exchanges experienced another record year with 108 new listings, in addition to 10 First North to Main Market upgrades.
- Strong momentum in U.S. listing switches in 2017. In 2017, The Nasdaq Stock Market eclipsed $1.2 trillion in aggregated market cap transferring from the NYSE since 2005. Global snack and beverage company PepsiCo, with a market capitalization of $169 billion, became the largest issuer ever to switch their exchange listing, and was joined by a diverse group of companies executing a listing switch to The Nasdaq Stock Market, including enterprise software firm Workday and global investment manager Principal Financial.
- Nasdaq's Auction on Demand continues to gain traction in the Nordics. Nasdaq launched a periodic auction feature in the Nordics during 2017 called Auction on Demand that is designed to satisfy both MiFID I and MiFID II transparency rules and help market participants execute both large and small orders. Trading using Nasdaq's Auction on Demand has increased steadily since launching in June 2017 and average daily volume in January 2018 more than doubled compared to December 2017.
ABOUT NASDAQ
Nasdaq (Nasdaq:NDAQ) is a leading global provider of trading, clearing, exchange technology, listing, information and public company services. Through its diverse portfolio of solutions, Nasdaq enables customers to plan, optimize and execute their business vision with confidence, using proven technologies that provide transparency and insight for navigating today's global capital markets. As the creator of the world's first electronic stock market, its technology powers more than 90 marketplaces in 50 countries, and 1 in 10 of the world's securities transactions. Nasdaq is home to approximately 3,900 total listings with a market value of approximately $13 trillion. To learn more, visit business.nasdaq.com.
NON-GAAP INFORMATION
In addition to disclosing results determined in accordance with U.S. GAAP, Nasdaq also discloses certain non-GAAP results of operations, including, but not limited to, net income attributable to Nasdaq, diluted earnings per share, operating income, and operating expenses, that include certain adjustments or exclude certain charges and gains that are described in the reconciliation table of U.S. GAAP to non-GAAP information provided at the end of this release. Management uses this non-GAAP information internally, along with U.S. GAAP information, in evaluating our performance and in making financial and operational decisions. We believe our presentation of these measures provides investors with greater transparency and supplemental data relating to our financial condition and results of operations. In addition, we believe the presentation of these measures is useful to investors for period-to-period comparisons of results as the items described below do not reflect ongoing operating performance.
These measures are not in accordance with, or an alternative to, U.S. GAAP, and may be different from non-GAAP measures used by other companies. Investors should not rely on any single financial measure when evaluating our business. We recommend investors review the U.S. GAAP financial measures included in this earnings release. When viewed in conjunction with our U.S. GAAP results and the accompanying reconciliations, we believe these non-GAAP measures provide greater transparency and a more complete understanding of factors affecting our business than U.S. GAAP measures alone.
We understand that analysts and investors regularly rely on non-GAAP financial measures, such as non-GAAP net income attributable to Nasdaq, non-GAAP diluted earnings per share, non-GAAP operating income and non-GAAP operating expenses to assess operating performance. We use these measures because they highlight trends more clearly in our business that may not otherwise be apparent when relying solely on U.S. GAAP financial measures, since these measures eliminate from our results specific financial items, such as those described below, that have less bearing on our ongoing operating performance.
Amortization expense of acquired intangible assets: We amortize intangible assets acquired in connection with various acquisitions. Intangible asset amortization expense can vary from period to period due to episodic acquisitions completed, rather than from our ongoing business operations. As such, if intangible asset amortization is included in performance measures, it is more difficult to assess the day-to-day operating performance of the businesses, the relative operating performance of the businesses between periods and the earnings power of Nasdaq. Management does not consider intangible asset amortization expense for the purpose of evaluating the performance of our business or its managers or when making decisions to allocate resources. Therefore, we believe performance measures excluding intangible asset amortization expense provide investors with a more useful representation of our businesses’ ongoing activity in each period.
Merger and strategic initiatives expense: We have pursued various strategic initiatives and completed a number of acquisitions in recent years which have resulted in expenses which would not have otherwise been incurred. These expenses generally include integration costs, as well as legal, due diligence and other third party transaction costs. The frequency and the amount of such expenses vary significantly based on the size, timing and complexity of the transaction. Accordingly, we exclude these costs for purposes of calculating non-GAAP measures which provide a more meaningful analysis of Nasdaq’s ongoing operating performance or comparisons in Nasdaq’s performance between periods.
Restructuring charges: Restructuring charges are associated with our 2015 restructuring plan to improve performance, cut costs and reduce spending and as of December 31, 2016 are primarily related to (i) severance and other termination benefits, (ii) asset impairment charges, and (iii) other charges. We exclude these restructuring costs because these costs do not reflect future operating expenses and do not contribute to a meaningful evaluation of Nasdaq’s ongoing operating performance or comparison of Nasdaq’s performance between periods.
Asset impairment charge: Intangible assets that have indefinite lives are reviewed for impairment at least annually, or when indicators of impairment are present. For the three months and year ended December 31, 2016, we recorded a pre-tax, non-cash asset impairment charge of $578 million related to the full write-off of the eSpeed trade name due to a continued decline in operating performance of the eSpeed business during 2016 and a rebranding of our Fixed Income business.
Other significant items: We have excluded certain other charges or gains, including certain tax items, that are the result of other non-comparable events to measure operating performance. We believe the exclusion of such amounts allows management and investors to better understand the financial results of Nasdaq. For the three months and year ended December 31, 2017, other significant items include a sublease loss reserve charge recorded on space we currently occupy due to excess capacity. For the year ended December 31, 2017, other significant items include loss on extinguishment of debt and wind down costs associated with an equity method investment that was previously written off. For the three months and year ended December 31, 2016, other significant items primarily include a regulatory fine received by our Nordic exchanges and clearinghouse, accelerated expense due to the retirement of the company’s former CEO for equity awards previously granted, a sublease loss reserve charge recorded on space we currently occupy due to excess capacity, and the impact of the write-off of an equity method investment, partially offset by a gain resulting from the sale of a percentage of a separate equity method investment. The credit of $1 million for the year ended December 31, 2016, pertains to the release of a previously recorded sublease loss reserve due to the early exit of a facility, partially offset by the sublease loss reserve charge recorded during the three months ended December 31, 2016.
Significant tax items: The non-GAAP adjustment to the income tax provision includes the tax impact of each non-GAAP adjustment in addition to the following items:
- The Tax Cuts & Jobs Act was enacted on December 22, 2017. For the three months and year ended December 31, 2017, we recorded a decrease to tax expense of $87 million, which reflects the estimated impact associated with the enactment of this act. The decrease in tax expense primarily relates to the remeasurement of our net U.S. deferred tax liability at the lower U.S. federal corporate income tax rate. The estimate may be refined in the future as new information becomes available.
- Excess tax benefits related to employee share-based compensation of $10 million for the three months ended December 31, 2017 and $40 million for the year ended December 31, 2017 was recorded as a result of the adoption of new accounting guidance on January 1, 2017. This guidance requires all income tax effects of share-based awards to be recognized as income tax expense or benefit in the income statement when the awards vest or are settled on a prospective basis, as opposed to stockholders’ equity where it was previously recorded, and will be a recurring item going forward. This item is subject to volatility and will vary based on the timing of the vesting of employee share-based compensation arrangements and fluctuations in our stock price, which is not in the control of management.
- The recognition of previously unrecognized tax benefits associated with positions taken in prior years of $8 million for the three months ended September 30, 2017 and $12 million for the year ended December 31, 2017.
- For the three months and year ended December 31, 2017, we recorded a decrease to tax expense of $6 million, which reflects the impact of amending our assertion regarding the indefinite reinvestment of earnings of certain subsidiaries outside the U.S.
- For the year ended December 31, 2016, we recorded a $27 million tax expense due to an unfavorable tax ruling received during the second quarter of 2016, the impact of which is related to prior periods.
Foreign exchange impact: In countries with currencies other than the U.S. dollar, revenues and expenses are translated using monthly average exchange rates. Certain discussions in this release isolate the impact of year-over-year foreign currency fluctuations to better measure the comparability of operating results between periods. Operating results excluding the impact of foreign currency fluctuations are calculated by translating the current period’s results by the prior period’s exchange rates.
CAUTIONARY NOTE REGARDING FORWARD-LOOKING STATEMENTS
Information set forth in this communication contains forward-looking statements that involve a number of risks and uncertainties. Nasdaq cautions readers that any forward-looking information is not a guarantee of future performance and that actual results could differ materially from those contained in the forward-looking information. Such forward-looking statements include, but are not limited to (i) projections relating to our future financial results, total shareholder returns, growth, trading volumes, products and services, order backlog, taxes and achievement of synergy targets, (ii) statements about the closing or implementation dates and benefits of certain acquisitions and other strategic, restructuring, technology, de-leveraging and capital return initiatives, (iii) statements about our integrations of our recent acquisitions, (iv) statements relating to any litigation or regulatory or government investigation or action to which we are or could become a party, and (v) other statements that are not historical facts. Forward-looking statements involve a number of risks, uncertainties or other factors beyond Nasdaq’s control. These factors include, but are not limited to, Nasdaq’s ability to implement its strategic initiatives, economic, political and market conditions and fluctuations, government and industry regulation, interest rate risk, U.S. and global competition, and other factors detailed in Nasdaq’s filings with the U.S. Securities and Exchange Commission, including its annual reports on Form 10-K and quarterly reports on Form 10-Q which are available on Nasdaq’s investor relations website at http://ir.nasdaq.com and the SEC’s website at www.sec.gov. Nasdaq undertakes no obligation to publicly update any forward-looking statement, whether as a result of new information, future events or otherwise.
WEBSITE DISCLOSURE
Nasdaq intends to use its website, ir.nasdaq.com, as a means for disclosing material non-public information and for complying with SEC Regulation FD and other disclosure obligations. These disclosures will be included on Nasdaq’s website under “Investor Relations.”
MEDIA RELATIONS CONTACT:
Allan Schoenberg
+1.212.231.5534
allan.schoenberg@nasdaq.com
INVESTOR RELATIONS CONTACT:
Ed Ditmire, CFA
+1.212.401.8737
ed.ditmire@nasdaq.com
-NDAQF-
| (1) Refer to the non-GAAP information section of the earnings release for further discussion of why we consider amortization expense of acquired intangible assets to be a non-GAAP adjustment. | ||||||||||||||||||||
| (2) For the three months and year ended December 31, 2017 and for the three months ended September 30, 2017, merger and strategic initiatives expense is primarily related to our acquisitions of eVestment, Inc. and International Securities Exchange, or ISE, as well as costs associated with the potential strategic alternatives for our Public Relations and Digital Media businesses within our Corporate Solutions business. For the three months and year ended December 31, 2016, merger and strategic initiatives expense primarily related to our acquisitions of ISE, Boardvantage, Inc., and Marketwired L.P. Refer to the non-GAAP information section of the earnings release for further discussion on why we consider merger and strategic initiatives expense to be a non-GAAP adjustment. | ||||||||||||||||||||
| (3) During 2016, we completed our 2015 restructuring plan. For the year ended December 31, 2016, restructuring charges primarily related to severance and other termination benefits, asset impairment charges, and other charges. | ||||||||||||||||||||
| (4) For the three months and year ended December 31, 2016, we recorded a pre-tax, non-cash intangible asset impairment charge of $578 million related to the full write-off of the eSpeed trade name due to a continued decline in operating performance of the eSpeed business during 2016 and a rebranding of our Fixed Income business. | ||||||||||||||||||||
| (5) During 2016, the Swedish Financial Supervisory Authority, or SFSA, completed their investigations of cybersecurity processes at our Nordic exchanges and clearinghouse. In December 2016, we were issued a $6 million fine by the SFSA as a result of findings in connection with its investigation. The SFSA's conclusions related to governance issues rather than systems and platform security. We have appealed the SFSA's decision, including the amount of the fine. The court has not yet reached a decision regarding our appeal. This charge is included in regulatory expense in the Condensed Consolidated Statements of Income (Loss) for the three months and year ended December 31, 2016. | ||||||||||||||||||||
| (6) For the three months and year ended December 31, 2016, we recorded $12 million in accelerated expense due to the retirement of the company’s former CEO for equity awards previously granted. | ||||||||||||||||||||
| (7) For the three months and year ended December 31, 2017 and for the three months ended December 31, 2016, we established a sublease loss reserve on space we currently occupy due to excess capacity. The credit of $1 million for the year ended December 31, 2016, pertains to the release of a previously recorded sublease loss reserve due to the early exit of a facility, partially offset by a sublease loss reserve charge recorded on space we currently occupy due to excess capacity. | ||||||||||||||||||||
| (8) For the year ended December 31, 2017, in connection with the early extinguishment of our 5.25% senior unsecured notes and the $300 million repayment on our $400 million senior unsecured term loan facility due November 25, 2019, we recorded a charge of $10 million primarily related to a premium paid for early redemption. | ||||||||||||||||||||
| (9) For the year ended December 31, 2017, other charge relates to wind down costs associated with an equity method investment that was previously written off, which is included in net income (loss) from unconsolidated investees in the Condensed Consolidated Statements of Income (Loss). For the three months and year ended December 31, 2016, other charges primarily include the impact of the write-off of an equity method investment, partially offset by a gain resulting from the sale of a percentage of a separate equity method investment. We recorded the net loss in net income (loss) from unconsolidated investees in the Condensed Consolidated Statements of Income (Loss). | ||||||||||||||||||||
| (10) The non-GAAP adjustment to the income tax provision includes the tax impact of each non-GAAP adjustment. In addition, the non-GAAP adjustment to the income tax provision reflects the recognition of previously unrecognized tax benefits associated with positions taken in prior years of $8 million for the three months ended September 30, 2017 and $12 million for the year ended December 31, 2017. For the three months and year ended December 31, 2017, we recorded a decrease to tax expense of $6 million, which reflects the impact of amending our assertion regarding the indefinite reinvestment of earnings of certain subsidiaries outside the U.S. For the year ended December 31, 2016, we recorded a $27 million tax expense due to an unfavorable tax ruling received during the second quarter of 2016, the impact of which is related to prior periods. | ||||||||||||||||||||
| (11) The Tax Cuts & Jobs Act was enacted on December 22, 2017. For the three months and year ended December 31, 2017, we recorded a decrease to tax expense of $87 million, which reflects the estimated impact associated with the enactment of this act. The decrease in tax expense primarily relates to the remeasurement of our net U.S. deferred tax liability at the lower U.S. federal corporate income tax rate. The estimate may be refined in the future as new information becomes available. | ||||||||||||||||||||
| (12) For the three months and year ended December 31, 2017 and for the three months ended September 30, 2017, excess tax benefits relates to employee share-based compensation resulting from the adoption of new accounting guidance which requires all income tax effects of share-based awards to be recognized as income tax expense or benefit in the income statement when the awards vest or are settled on a prospective basis, as opposed to stockholders’ equity where it was previously recorded. Refer to the non-GAAP information section of the earnings release for further discussion on why we consider excess tax benefits related to employee share-based compensation to be a non-GAAP adjustment. |
| (1) Refer to the non-GAAP information section of the earnings release for further discussion of why we consider amortization expense of acquired intangible assets to be a non-GAAP adjustment. | |||||||||||||||||||||
| (2) For the three months and year ended December 31, 2017 and for the three months ended September 30, 2017, merger and strategic initiatives expense is primarily related to our acquisitions of eVestment, Inc. and ISE, as well as costs associated with the potential strategic alternatives for our Public Relations and Digital Media businesses within our Corporate Solutions business. For the three months and year ended December 31, 2016, merger and strategic initiatives expense primarily related to our acquisitions of ISE, Boardvantage, Inc., and Marketwired L.P. Refer to the non-GAAP information section of the earnings release for further discussion on why we consider merger and strategic initiatives expense to be a non-GAAP adjustment. | |||||||||||||||||||||
| (3) During 2016, we completed our 2015 restructuring plan. For the year ended December 31, 2016, restructuring charges primarily related to severance and other termination benefits, asset impairment charges, and other charges. | |||||||||||||||||||||
| (4) During 2016, the SFSA, completed their investigations of cybersecurity processes at our Nordic exchanges and clearinghouse. In December 2016, we were issued a $6 million fine by the SFSA as a result of findings in connection with its investigation. The SFSA's conclusions related to governance issues rather than systems and platform security. We have appealed the SFSA's decision, including the amount of the fine. The court has not yet reached a decision regarding our appeal. This charge is included in regulatory expense in the Condensed Consolidated Statements of Income (Loss) for the three months and year ended December 31, 2016. | |||||||||||||||||||||
| (5) For the three months and year ended December 31, 2016, we recorded $12 million in accelerated expense due to the retirement of the company’s former CEO for equity awards previously granted. | |||||||||||||||||||||
| (6) For the three months and year ended December 31, 2017 and for the three months ended December 31, 2016, we established a sublease loss reserve on space we currently occupy due to excess capacity. The credit of $1 million for the year ended December 31, 2016, pertains to the release of a previously recorded sublease loss reserve due to the early exit of a facility, partially offset by a sublease loss reserve charge recorded on space we currently occupy due to excess capacity. | |||||||||||||||||||||
| (7) In connection with the early extinguishment of our 5.25% senior unsecured notes and the $300 million repayment on our $400 million senior unsecured term loan facility due November 25, 2019, we recorded a charge of $10 million primarily related to a premium paid for early redemption. | |||||||||||||||||||||
| (8) U.S. GAAP operating margin equals U.S.GAAP operating income divided by total revenues less transaction-based expenses. | |||||||||||||||||||||
| (9) Non-GAAP operating margin equals non-GAAP operating income divided by total revenues less transaction-based expenses. | |||||||||||||||||||||
| (1) Refer to the non-GAAP information section of the earnings release for further discussion of why we consider amortization expense of acquired intangible assets to be a non-GAAP adjustment. | |||||||||||||||||||||
| (2) For the three months and year ended December 31, 2017 and for the three months ended September 30, 2017, merger and strategic initiatives expense is primarily related to our acquisitions of eVestment, Inc. and ISE, as well as costs associated with the potential strategic alternatives for our Public Relations and Digital Media businesses within our Corporate Solutions business. For the three months and year ended December 31, 2016, merger and strategic initiatives expense primarily related to our acquisitions of ISE, Boardvantage, Inc., and Marketwired L.P. Refer to the non-GAAP information section of the earnings release for further discussion on why we consider merger and strategic initiatives expense to be a non-GAAP adjustment. | |||||||||||||||||||||
| (3) During 2016, we completed our 2015 restructuring plan. For the year ended December 31, 2016, restructuring charges primarily related to severance and other termination benefits, asset impairment charges, and other charges. | |||||||||||||||||||||
| (4) During 2016, the SFSA, completed their investigations of cybersecurity processes at our Nordic exchanges and clearinghouse. In December 2016, we were issued a $6 million fine by the SFSA as a result of findings in connection with its investigation. The SFSA's conclusions related to governance issues rather than systems and platform security. We have appealed the SFSA's decision, including the amount of the fine. The court has not yet reached a decision regarding our appeal. This charge is included in regulatory expense in the Condensed Consolidated Statements of Income (Loss) for the three months and year ended December 31, 2016. | |||||||||||||||||||||
| (5) For the three months and year ended December 31, 2016, we recorded $12 million in accelerated expense due to the retirement of the company’s former CEO for equity awards previously granted. | |||||||||||||||||||||
| (6) For the three months and year ended December 31, 2017 and for the three months ended December 31, 2016, we established a sublease loss reserve on space we currently occupy due to excess capacity. The credit of $1 million for the year ended December 31, 2016, pertains to the release of a previously recorded sublease loss reserve due to the early exit of a facility, partially offset by a sublease loss reserve charge recorded on space we currently occupy due to excess capacity. | |||||||||||||||||||||
| (7) In connection with the early extinguishment of our 5.25% senior unsecured notes and the $300 million repayment on our $400 million senior unsecured term loan facility due November 25, 2019, we recorded a charge of $10 million primarily related to a premium paid for early redemption. | |||||||||||||||||||||
1Represents revenues less transaction-based expenses.
2Constitutes revenues from Market Technology, Information Services, Corporate Services and Trade Management Services.
3Refer to our reconciliations of U.S. GAAP to non-GAAP net income (loss), diluted earnings (loss) per share, operating income and operating expenses, included in the attached schedules.
4U.S. GAAP operating expense and tax guidance is not provided due to the inherent difficulty in quantifying certain amounts due to a variety of factors including the unpredictability in the movement in foreign currency rates, as well as future charges or reversals outside of the normal course of business.
Disclaimer: The above is a matter of opinion provided for general information purposes only and is not intended as investment advice. Information and analysis above are derived from sources and ...
more

