
Mid Cap Best & Worst Report - February 10, 2016
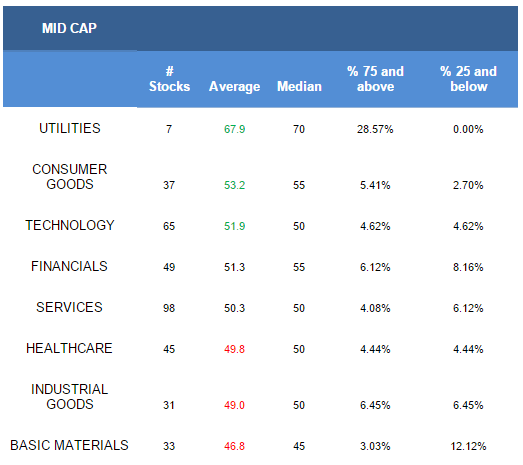
- The top mid cap sectors are utilities and consumer goods.
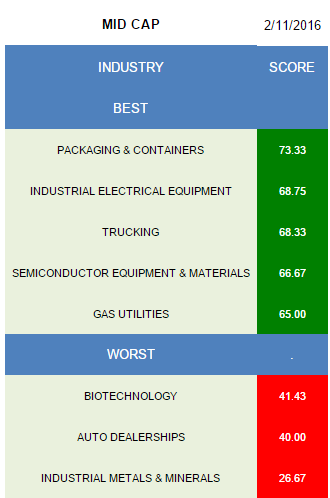
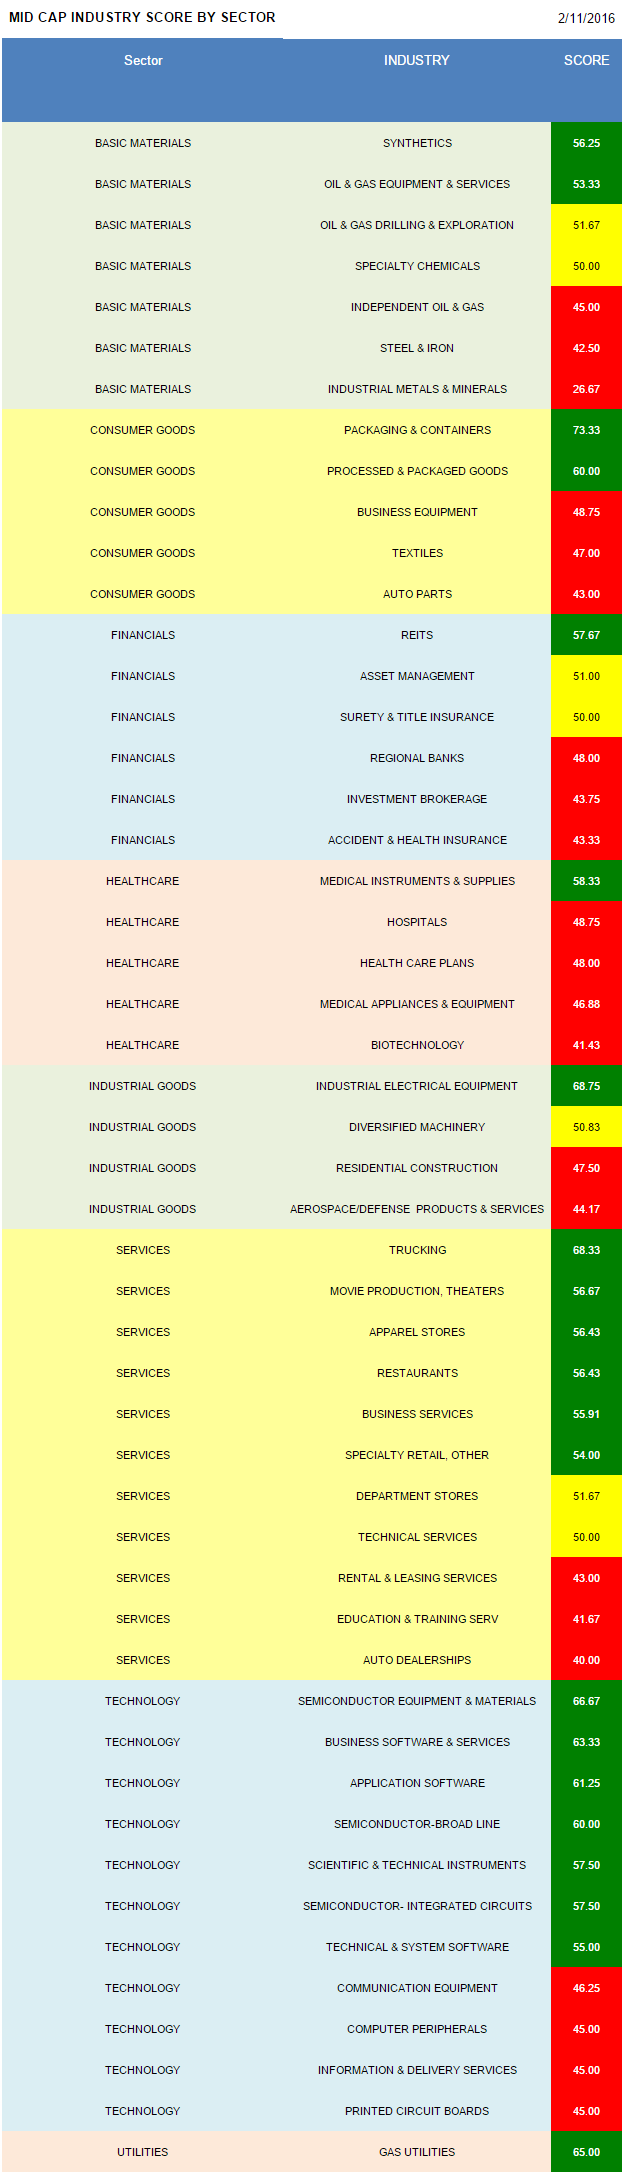
- Packaging and containers is the best scoring industry.
The average mid cap score is 50.91, which is below the four week average score of 52.61. The average mid cap stock is trading -34.23% below its 52 week high, -15.3% below its 200 dma, has 6.33 days to cover held short, and is expected to grow its EPS by 12.97% in the next year.
Utilities, consumer goods, and technology are the top scoring mid cap sectors. Financials and services score in line with the average universe score. Healthcare, industrial goods, and basics score below average.
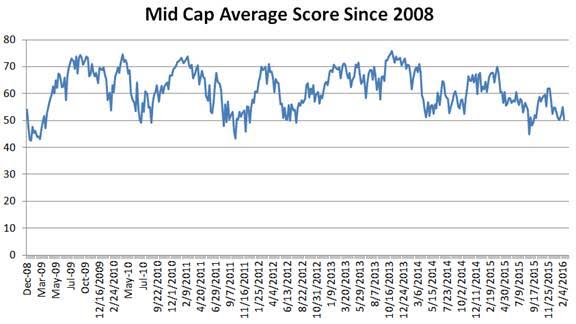
The following chart shows historical mid cap scores since 2008. Historically, readings below 50 have corresponded with actionable buy points.
The top mid cap industry is packaging and containers (BMS, TUP, MINI). Industrial electrical (LFUS, BDC, RBC), trucking (KNX, ODFL, HTLD), semi equipment (SPIL, TER) and gas utilities (NJR, PNY) are also high scoring.
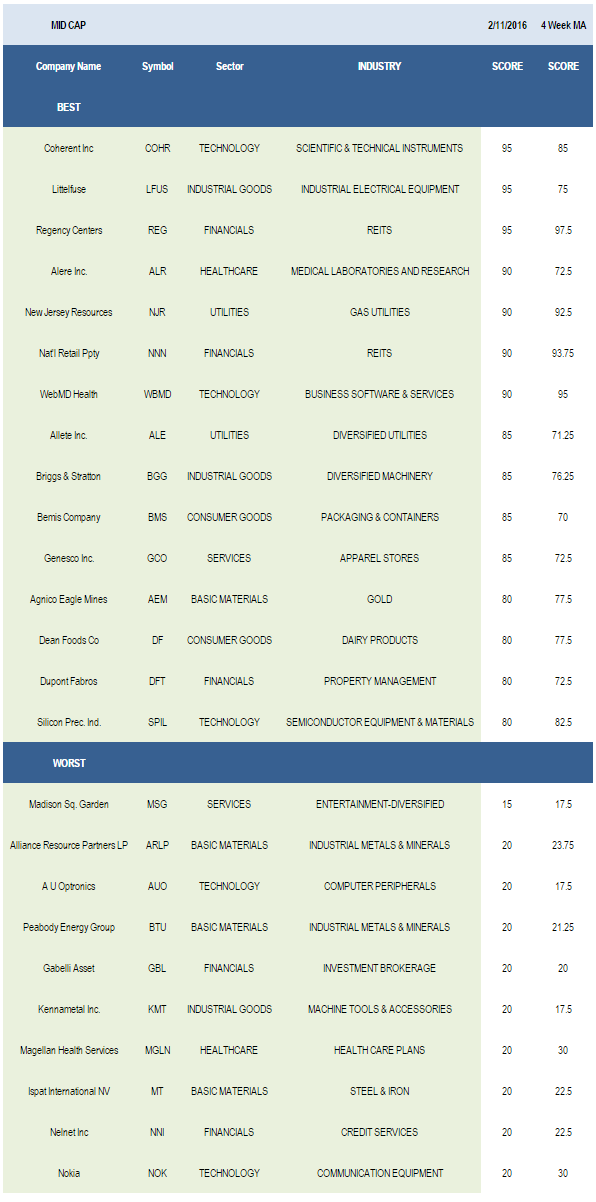
Synthetics (MTX, CMP, AXLL) and oil & gas equipment & services (PDS) score best in basics. Packaging & containers and processed & packaged goods (GIS, FLO) are top scoring in consumer goods. The strongest group in financials is REITs (REG, NNN, KRC, CLI). Only medical instruments (HAE, TFX, PKI) have an above average score in healthcare. Industrial electrical is best in industrial goods. Trucking, movies (LGF, RGC), and apparel stores (GCO, ANF, GES) can be bought in services. Semi equipment, business software (WBMD, VRNT, ROVI), and application software (LOCK, MANH, FTNT) are most attractive across technology. Gas utilities can also be bought.
Disclosure: None.


