
Microsoft Corporation Stock On Course To Breach $65
From a fundamental perspective, there are many ways to get a target price. Without looking at a chart, there is no way to know the tendency of getting there. There is noway around it, you gotta look at the charts.
While many analysts seem content at setting a target near the all-time high of around 60 dollars, I am ignoring that.Microsoft Corporation (Nasdaq:MSFT) stock will break through that target, and when it does,it will be violent.

Remember the SPX? Remember how no one thought we would break-through that 2120 level? What these analysts fail to observe is that the more times a level fails, the more powerful the break from it. You can only hold a level for so long.
(Click on image to enlarge)
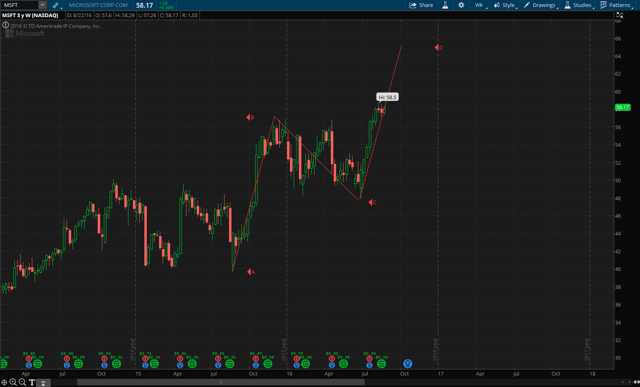
When I look at a weekly chart, I am currently seeing a long-term ABCD wave pattern in progress for Microsoft stock price. This is one of the oldest reoccurring patterns. Don't get hung up on the text book definition of this pattern, it will drive you crazy as you will miss the bigger picture of the current development. Also, don't get hung up on the terminology.
If you are an Elliot wave practitioner, you know this is a Wave three in progress. And, wave three is typically the largest and most profitable wave.
I can even call this a harmonic, Fibonacci pattern or even market symmetry. The point is whatever you call it and as long as you are able to identify it, the results are the same. Think of it as the same bottle of wine poured in different glasses.
What I have drawn is the following:
The first leg represents A to B, which is the initial uptrend.
B to C is the pullback. Keep in mind while this leg is forming, we do not know that it is an actual pullback until it breaks and closes above B. Since price broke above B and closed above B creating a new high, I am projecting that the formation will finish.
Taking the length from A to B and projecting it from C, gives us the C to D leg. This leg projects to around $65 provided that the overall market continues higher. This one indication may not be enough for you. That is fine. In both technical and fundamental analysis, a confluence off actors is used to support a belief.
(Click on image to enlarge)
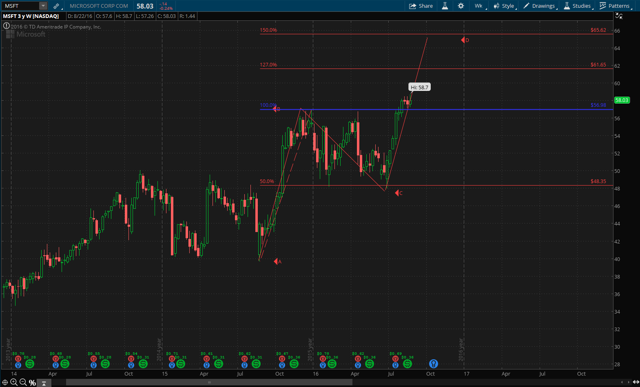
Taking a Fibonacci extension and retracement from the AB wave, we can see that wave BC was the 50 percent retracement of wave AB. We can also see that the projected move of wave CD terminates at the 150% Fibonacci level. This gives us more confidence that over the long term, Microsoft stock will hit the 65 dollar level. When the target will get hit, no one knows. It is just a matter of monitoring the day to day and week to week situation of the markets to see if any abnormalities will potentially terminate the current uptrend. As always, the stock market is a game of probabilities. Manage your risk accordingly.
Disclosure: I do not hold any positions in the stocks mentioned in this post and don't intend to initiate a position in the next 72 hours. I am not an ...
more

