
Markets Rally As Expected...Now What?
In last weekend’s newsletter, I suggested the markets could rally this week with some very specific caveats. Let’s review where we are. (All charts updated through Friday.)
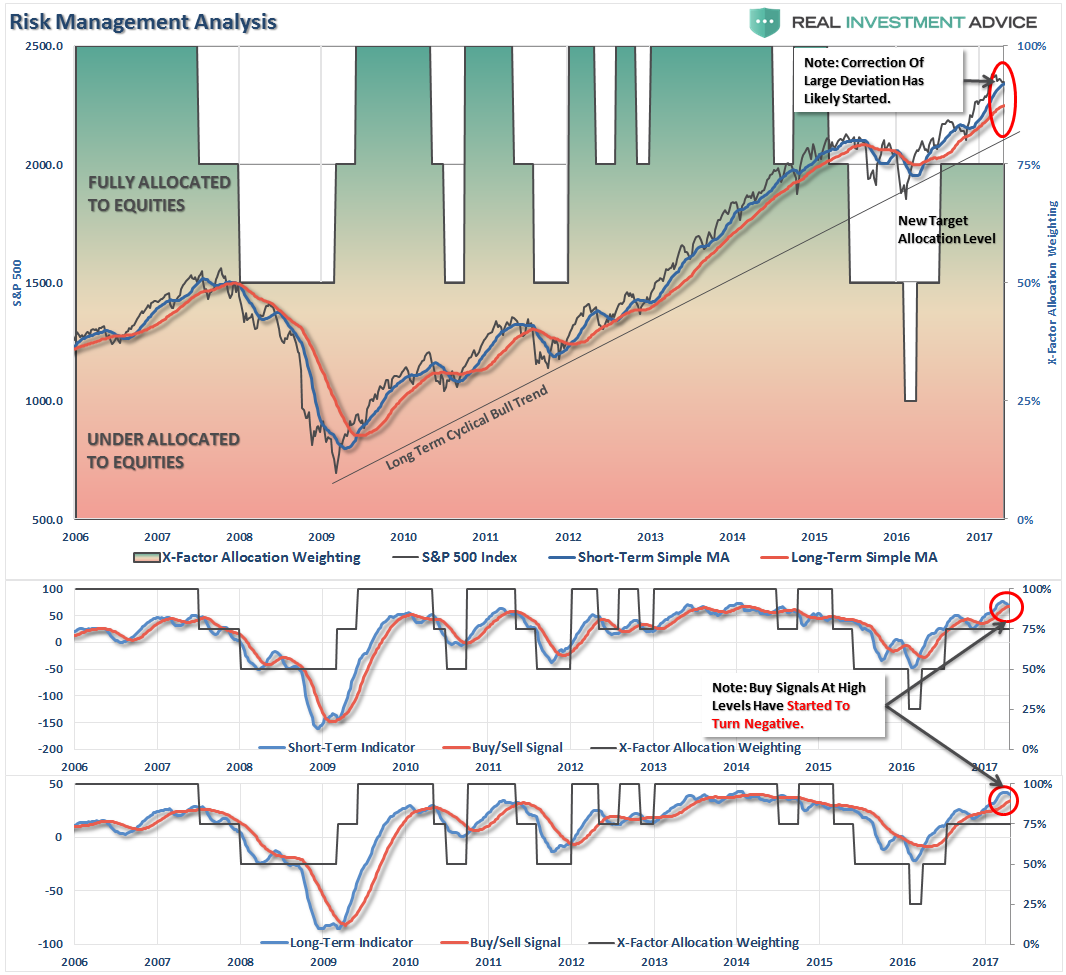
“The market has now tripped the first signal as shown above, and below, sending a warning that further weakness could ensue. With the first signal registered, combined with a break of the 50-dma, we are now on ‘a signal-1 alert.'”
“With portfolios already hedged, as we added a lot of bond and interest rate sensitive holdings back in January, there is no action to take currently. This is why, for now, it is only an ‘alert’ that something more important is developing.
IMPORTANT: By the time weekly signals are issued on an intermediate-term basis, the market is generally oversold, with ‘bearish’ sentiment increasing, on a short-term (daily) basis. Given those short-term conditions, it is quite likely the markets will rally next week.”
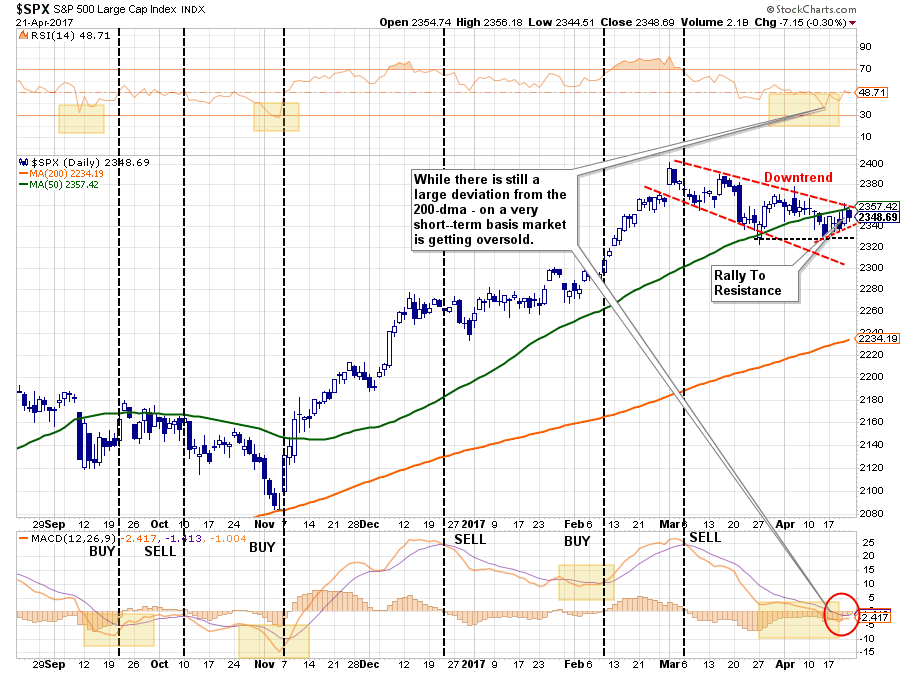
As expected the market did rally last week. As I noted it would be the success or failure of the rally attempt which would dictate what happens next.
- “If the market can reverse course next week, and move back above the 50-dma AND break the declining price trend from the March highs, then an attempt at all time highs is quite likely. (Probability Guess = 30%)
- However, a rally back to the 50-dma that fails will likely result in a continuation of the correction to the 200-dma as seen previously. From current levels that would suggest a roughly -5% drawdown. However, as shown below, those drawdowns under similar conditions could approach -15%. (Probability Guess = 70%)”
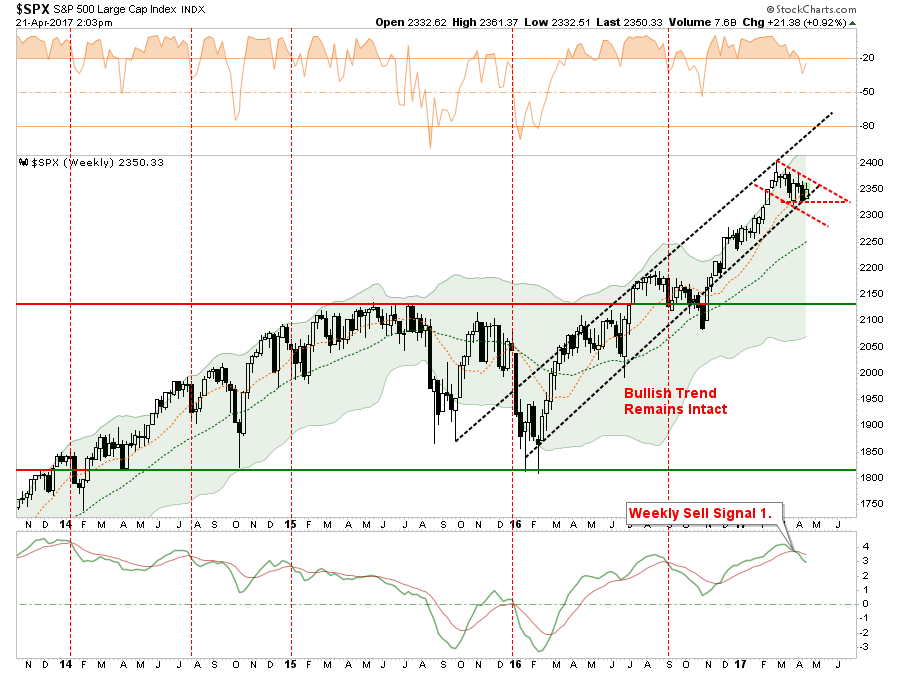
As of Friday, the market failed at resistance closing below the 50-dma for the week. As denoted by the red dashed lines, the current price action of the market is being compressed within a downtrend.
A “breakout” will likely occur next week which will fulfill one of the two potential outcomes noted above.
Second Warning Rising
The recent deterioration in the market is also threatening to trigger the second “sell signal” alert. Previously, such signals, particularly from high levels, have warned of deeper market corrections with this time likely not much different.
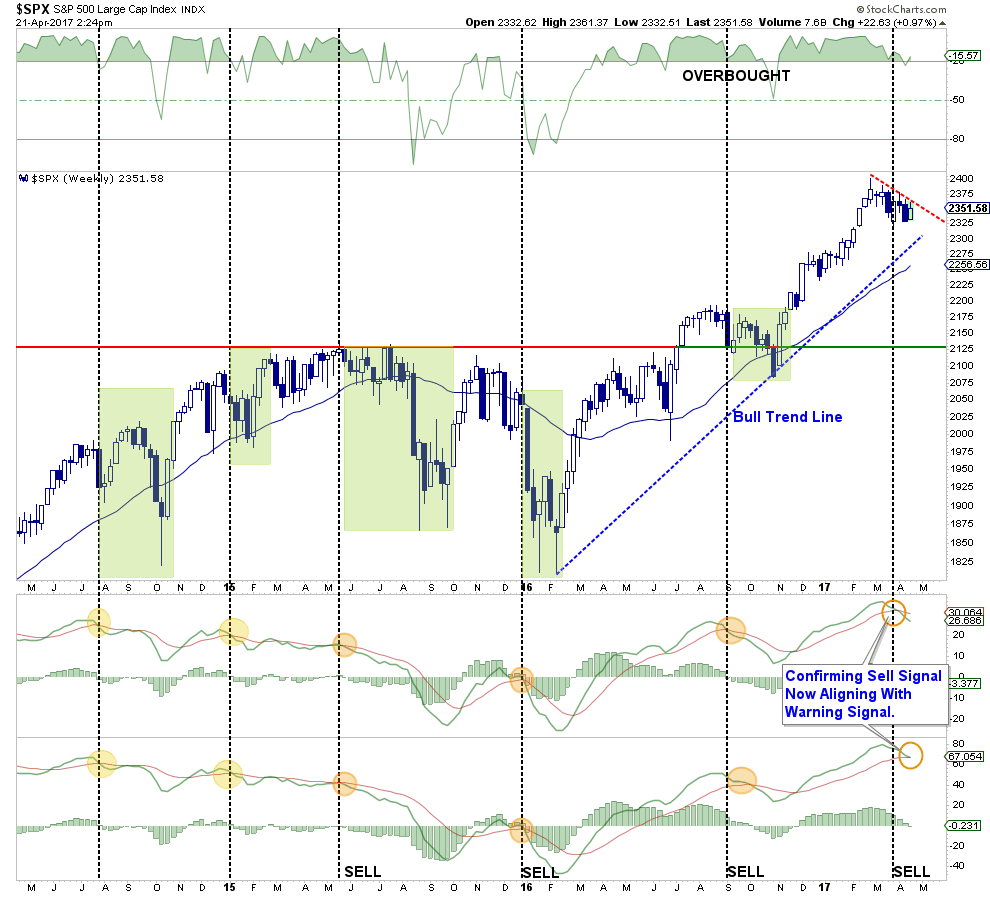
IMPORTANT: This does NOT mean liquidating into cash. The signal is CLOSE to being triggered BUT a strong rally next week would negate such an event keeping portfolios more heavily allocated towards equity risk. Nonetheless, this is certainly not a time to be overly complacent in portfolio allocations either.
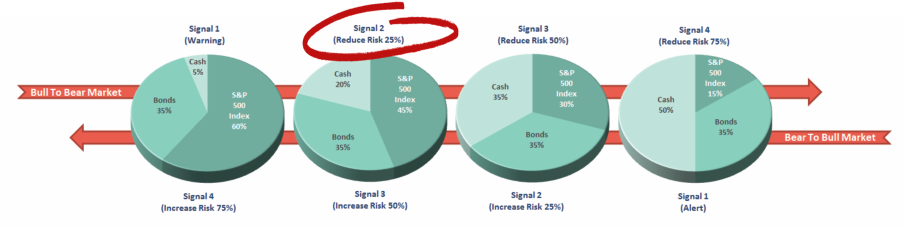
As I noted last week. The SECOND signal, when it is fully triggered, would reduce equity related portfolio allocations to 75% of target levels.
From a portfolio management perspective, it is never wise to make aggressive adjustments to allocations. By taking a measured approach, and monitoring outcomes, portfolio risk can be adjusted to changing market trends.
The advantage of this “ratcheting” approach keeps emotional biases somewhat in check. When individuals make big adjustments in one direction or another, it can become emotionally difficult to reverse such a decision. Investors tend to start rationalizing previous decisions rather than recognizing their mistake and quickly remedying the situation. However, by making small calculated moves, it is much easier to reallocate risk accordingly as market dynamics change.
As discussed last week, the follow guidelines should be sufficient in adjusting weightings and rebalancing overall portfolio risk.
PORTFOLIO ACTION GUIDELINES
Given this is only a “warning signal” currently, any RALLY in the next week should be used to take some action within portfolios. The following list provides some basic guidelines.
- Trimming back winning positions to original portfolio weights: Investment Rule: Let Winners Run
- Sell positions that simply are not working (if the position was not working in a rising market, it likely won’t in a declining market.) Investment Rule: Cut Losers Short
- Hold the cash raised from these activities until the next buying opportunity occurs. Investment Rule: Buy Low
These actions will temporarily reduce portfolio risk and raise cash levels which either provides a “hedge” against a subsequent downturn OR cash to buy better-performing assets if conditions improve.
For now, the market remains in a bullish trend. Outside of small tweaks and close monitoring, nothing has occurred, yet, which would warrant more drastic movements within the allocation model.
Caution, nothing more, is advised for now.
It’s Up To Congress
On Thursday, the market rallied sharply on the back of some “top-notch jawboning” from the newly minted Treasury Secretary, Steve Mnuchin when he stated on CNBC:
“The Trump administration is close to bringing forward major tax reform, and will unveil a plan very soon.”
Despite a complete lack of details, the markets rallied on “hope” once again. After all, it is the “tax cut/reform” bill that is almost entirely behind the optimistic outlook for earnings per share climbing sharply by 2018 to justify current valuations.
However, there are a few hurdles Congressional Republicans will have to deal with as they return to Capitol Hill next week.
First, the “debt ceiling” will be hit on April 28th which will need to be immediately addressed. As I discussed last week with “former Freedom Caucus” member Congressman Ted Poe, it is likely Congress will immediately pass a “One-Week Continuing Resolution” in order to buy time needed to negotiate a“CR” for the rest of the 2017 fiscal year through August.
However, as Congressman Poe points out this negotiation will likely come at a “cost” of funding previous ACA requirements and “Planned Parenthood” which many Congressional Republicans strongly oppose. Also, the issues of “border wall funding” and “immigration” specifically related to the funding of the “deportation task force.”
In other words, there is a risk that a one-week CR turns into a full-blown CR as both sides clash over opposing views. Such an outcome will be a significant headwind for the financial markets as the“sequence” of events that need to occur to get to the “promised land” of tax cuts begins to back up.
- Debt Ceiling needs to be raised to allow for continuing Governmental operations BEFORE
- Healthcare “repeal and replace” bill can be passed next to resolve the imputed tax liabilities and costs which must be done BEFORE
- Tax cut/reform bill can be passed to resolve budgetary (revenue) issues BEFORE
- Infrastructure spending can be passed.
The reason I say this sequence of events is a potential problem is because there is an EXTREMELY high level of disappointment that can occur EVEN if Congress passes bills approving all of the legislative items above.
Just because Congress approves bills, where they have a healthier voting margin over Democrats, there is only a one* vote majority in the Senate. With a 60-vote requirement in the Senate it is likely that many of these bills will either never pass the Senate, OR will become extremely watered down versions of their original forms.
Bluntly speaking – the possibilities of “repealing and replacing” healthcare with a “really great health care plan,” significant “tax reform/cuts” and “infrastructure spending” realistically have very low odds over the next 12-months given the variety of factions within the Republican party.
I agree with Cowen’s Chris Kruger:
“White House’s misconception they have any leverage with Democrats when it’s the opposite, as Congressional Democrats have less than zero incentive to compromise with Trump and Trump needs them to keep govt from shutting down.”
This puts the financial markets, which are currently remaining elevated on “hopes” of significant reform at risk of significant potential “repricing risk” in the future.
Having a little “dry powder” makes some sense over the next month until the path forward, or not, becomes more evident.
The Last Time
Simon Black made a very interesting observation on Friday:
“A few days ago Charles Schwab, the investment brokerage firm, announced that the number of new brokerage accounts soared 44% during the first quarter of 2017.
More specifically, Schwab stated that individual investors are opening up stock trading accounts at the fastest pace the company has seen in 17 years.”
Hmm…remember what happened 17 years ago?
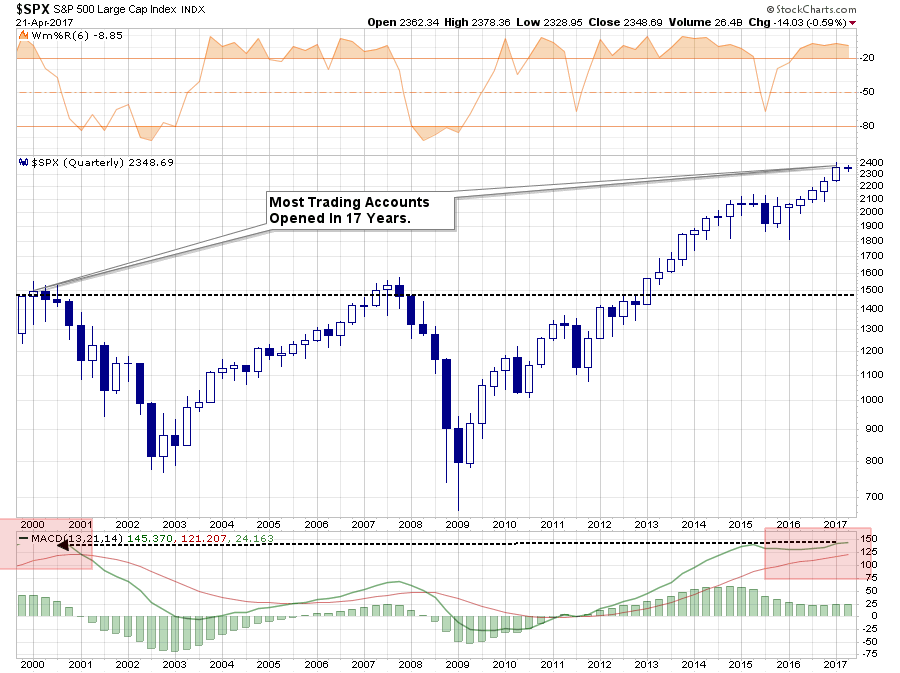
“Investors are once again clamoring to buy expensive, popular stocks at price levels never before seen in the history of the stock market.
- At 26.44, the S&P 500’s Price/Earnings ratio is the highest EVER, except for two occasions: the 2008 crash, and the 2000 crash.
- At 28.93, the “Shiller P/E ratio”, which looks at company valuations over a longer-term, 10-year period and adjusts for inflation, is at the highest level EVER, except for two occasions: the 2000 crash, and the 1929 crash.
- Price to sales ratios are near the highest levels in at least 50 years.
- Price to book ratios haven’t been at this level since the 2008 crash.
- And the stock market cap to GDP ratio is the highest since the 2000 crash.”
While such a data point doesn’t mean the markets are set to crash tomorrow, it is certainly worth considering the “risk” being undertaken to achieve potentially very limited “rewards” from current levels.
Market & Sector Analysis
Data Analysis Of The Market & Sectors For Traders
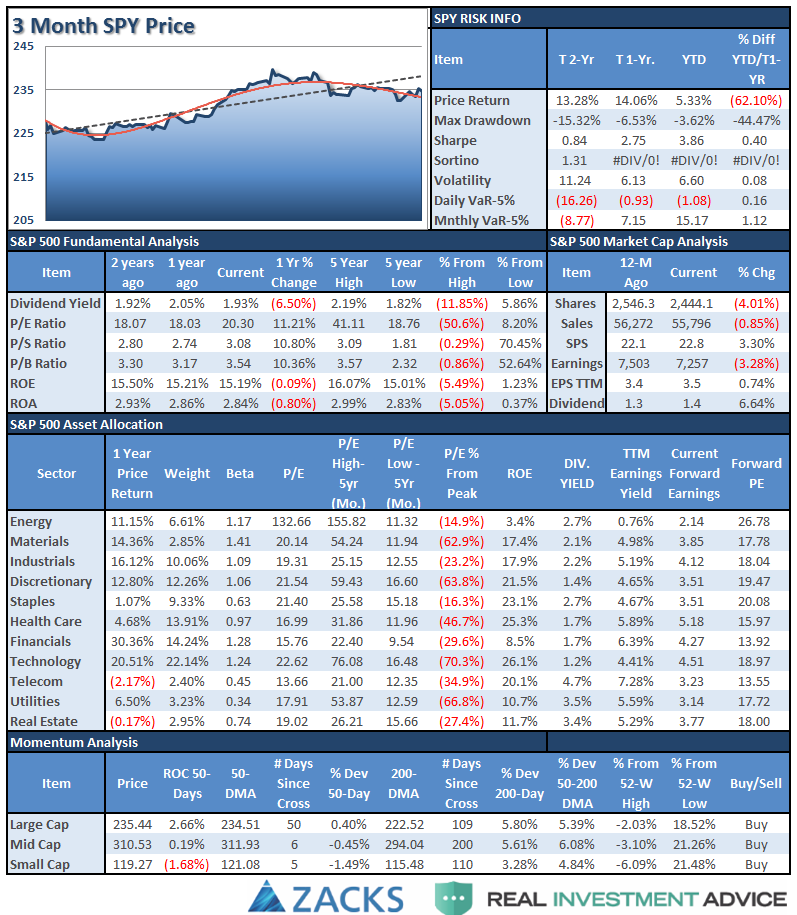
S&P 500 Tear Sheet
The “Tear Sheet” below is a “reference sheet” provide some historical context to markets, sectors, etc. and looking for deviations from historical extremes.
If you have any suggestions or additions you would like to see, send me an email.
Sector Analysis
The slow-motion correction that began back in March continued again this past week, with the market rallying, as expected last week, but failing at the 50-dma as resistance builds. This also triggered a weekly sell-signal as discussed above, and potentially a secondary weekly “sell” signal as well. The markets must significantly gain traction next week if a deeper correction is to be avoided for now.
In January of this year, I discussed how the various sectors of the market “rotate” over time. To wit:
“The video below shows the historical “rotation” of sectors over the last 3-years. As you will notice sectors have consistently “swarmed” in a clockwise rotation going from strongly outperforming the S&P 500 index to strongly underperforming. If you watch to the end of the video you will see the post-presidential election anomaly form.”
I have notated the changes on the Sector Rotation model below. In January, the set up for a rotation, following the November election was apparent. It was at that time that we began to overweight bonds, utilities, and REIT’s in portfolios DESPITE the calls from the media that rates had “nowhere to go but up because of the Fed.”
Four months later, we have now lightened up on that trade a bit, but still remain primarily long the improving and leading sectors.
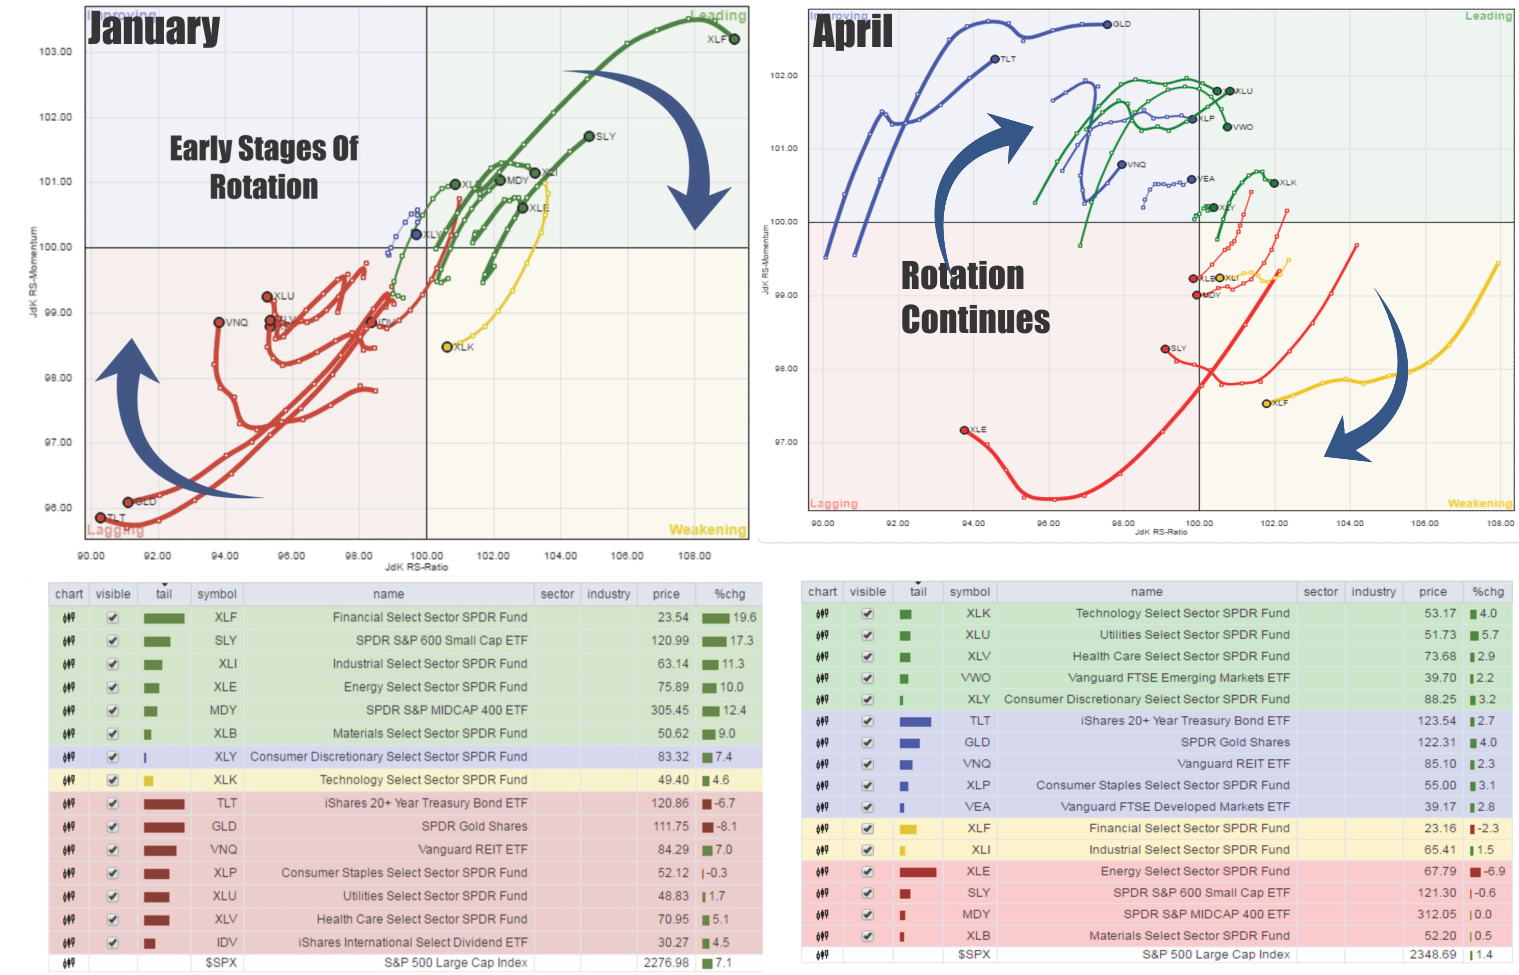
Remain cautious currently as the “Trump Trade” has continued to weaken over the last week.

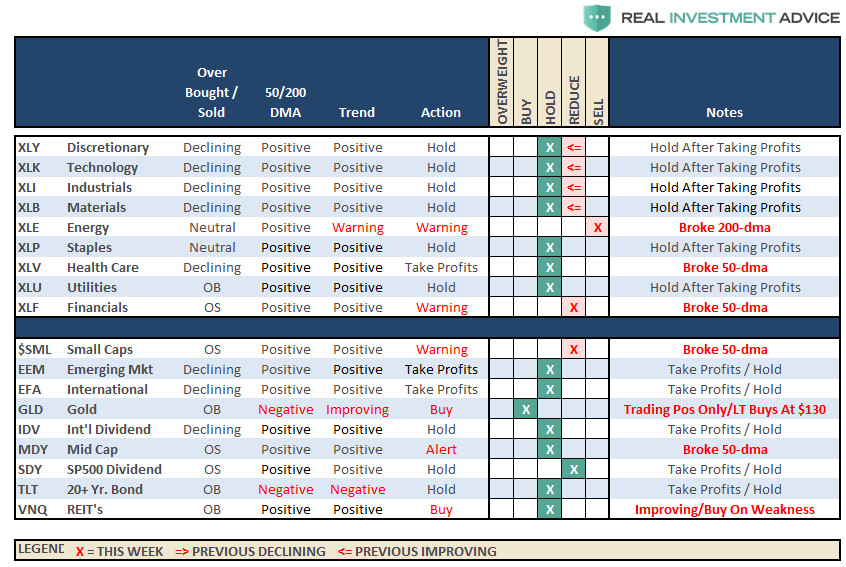
Despite the ongoing struggles with the “retail sector,” Discretionary stocks bounced off their 50-dma last week to maintain its bullish bias. However, that surge also pushed the sector back into overbought status.
Technology, Industrials, and Materials sectors continue to struggle with their respective 50-day moving averages. While still trending positively, relative performance has weakened substantially for now.
Energy continues to struggle after breaking its 50-dma and broke its 200-dma two weeks. While energy had a bit of a bounce last week, and tested resistance at the 50-dma, the bounce failed and the trend continues to materially weaken. Energy is very close to a major sector sell signal. Remain heavily underweight energy for the time being.
Healthcare and Financials have broken their 50-dma. Underweight these sectors for now.
Bonds, Utilities, and Staples all continue to be the clear winners, which we were discussing back in January, as the Trump Trade was going to reverse. Those hedges have continued to perform well despite the weakness in other areas of the market. We did take profits last week in some of our holdings.
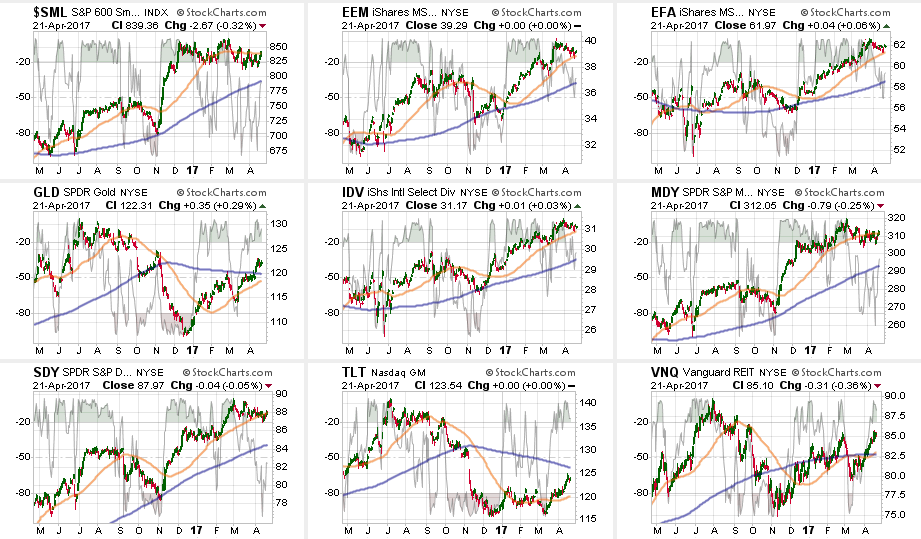
Small and Mid-Cap stocks continued to weaken in terms of relative performance and have broken their respective 50-dma’s. The deterioration of relative strength continues to suggest caution.
Emerging Markets, International, and Dividend Yielding Stocks are also showing weakness but remain in a bullish trend currently. Some profit taking and rebalancing is advised.
Bonds and REIT’s currently overbought and some profit taking is advised. If the broader markets can rally over the next week or two, simply due to a reflexive oversold condition, look for these sectors to pull back to provide a better entry point.
The table below shows thoughts on specific actions related to the current market environment.
(These are not recommendations or solicitations to take any action. This is for informational purposes only related to market extremes and contrarian positioning within portfolios. Use at your own risk and peril.)
Portfolio Update:
After hedging our long-equity positions 18-weeks ago with deeply out-of-favor sectors of the market (Bonds, REIT’s, Staples, Utilities, Health Care and Staples) we did rebalance some of our long-term CORE equity holdings back to original portfolio weightings harvesting a bit of liquidity.
While the bullish trend is still positive, which keeps us allocated on the long-side of the market, the weekly “sell signal” alert is not being dismissed. As I penned here last week:
“Any rally next week that ‘fails’ to put the market back on more solid footing will be used to reduce risk in portfolios to some degree and rebalance back to target weightings.”
We did raise some cash last week out of overbought sectors, and are waiting to see if the markets can regain some strenth this coming week as noted above.
We are still maintaining hedges until the current corrective action completes. Furthermore, we are currently maintaining ‘new money’ in short-term cash positions and only selectively stepping into core long-term holdings with tight stop-loss levels.”
We continue to maintain very tight trailing stops as the mid to longer-term dynamics of the market continue to remain very unfavorable.
THE REAL 401k PLAN MANAGER
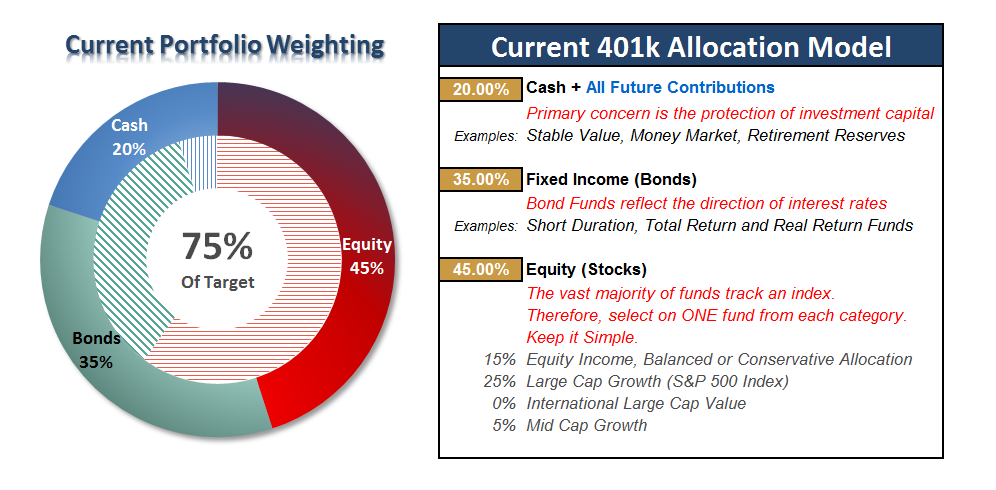
The Real 401k Plan Manager – A Conservative Strategy For Long-Term Investors
There are 4-steps to allocation changes based on 25% reduction increments. As noted in the chart above a 100% allocation level is equal to 60% stocks. I never advocate being 100% out of the market as it is far too difficult to reverse course when the market changes from a negative to a positive trend. Emotions keep us from taking the correct action.

Sell Signal Alert-2 Approaches
The consolidation in the market over the last few weeks – failed.
As I had noted over the last month, I was looking for an opportunity to move allocations back to the 100% allocation target but the risk/reward dynamic for such a move had not been favorable.
This past week, as detailed in the main missive above, the market broke through support at the 50-dma, failed at the retest, spun off an initial “alert” sell signal and is now threatening to issue a secondary “sell” signal. As such, all allocation adjustments remain on hold until the market correction is completed or reversed.
As noted in the 401k-chart above, the current extension above the moving average has started to correct. The buy signals are beginning to contract and the deviation above the long-term average is being reduced. As I noted last week:
“Importantly, the ‘warning’ signal is just that…a warning. As long as the correction process is confined to a bullish trend, a reversal of the corrective action will allow for an increase in the model exposure. But that time is not now.”
Importantly, if the secondary “signal” is issued, then the market will catch up with the allocation model putting us back on the “right side” of the trade. The market must rally next week and rise above the 50-dma to keep that secondary signal from being issued.
Maintain cash, rebalance portfolio allocations and reduce risk. If the economic data continues its string of weakness, geopolitical tensions continue to mount or some other exogenous issue impacts the market in the short-term, you will be thankful for the extra cushion.
As noted above, we did take profits out of bond holdings last week and rebalanced back to targets. The fall in rates, as expected, has gotten a bit overdone. We are looking for a retracement in rates, which would be coincident with a market rally, back toward the 2.4% area. Refrain from adding further fixed income holdings, for now, take some profits from overweight holdings, but maintain exposures.
If you need help after reading the alert; don’t hesitate to contact me.
Current 401-k Allocation Model
The 401k plan allocation plan below follows the K.I.S.S. principal. By keeping the allocation extremely simplified it allows for better control of the allocation and a closer tracking to the benchmark objective over time. (If you want to make it more complicated you can, however, statistics show that simply adding more funds does not increase performance to any great degree.)
401k Choice Matching List
The list below shows sample 401k plan funds for each major category. In reality, the majority of funds all track their indices fairly closely. Therefore, if you don’t see your exact fund listed, look for a fund that is similar in nature.

Disclosure: The information contained in this article should not be construed as financial or investment advice on any subject matter. Streettalk Advisors, LLC expressly disclaims all liability in ...
more

