
Market Breaks Support As Sell Signals Trigger
Let me pick up with where I left off last week:
“But first, let’s take a quick review of the markets which currently are flashing some very troubling signs.
Previously, I discussed the ongoing consolidation and struggle as the markets remain “trapped” between downtrend resistance and the crucial support levels of the previous breakout to new highs.“
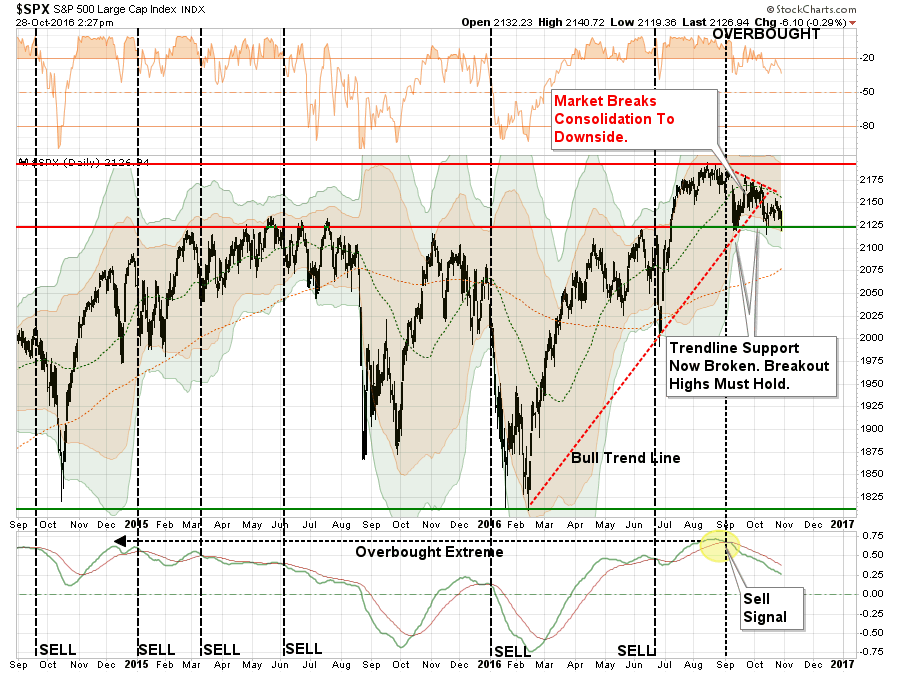
“Importantly, while the market has remained in suspended animation over the past three months, the deterioration of the market is quite evident. As long as the markets can maintain support about 2125, the bull market is still in play, but at this point, not by much.”
This past week that support gave way leading to the first 9-day straight decline in the index since 1980.
However, as I explained during the “Real Investment Hour” on Thursday, it is never advisable to “panic sell” when a break of support occurs. This is because that by the time you have an extended period of selling, the markets tend to be oversold enough for a short-term reflexive bounce to rebalance portfolio risk at better levels.
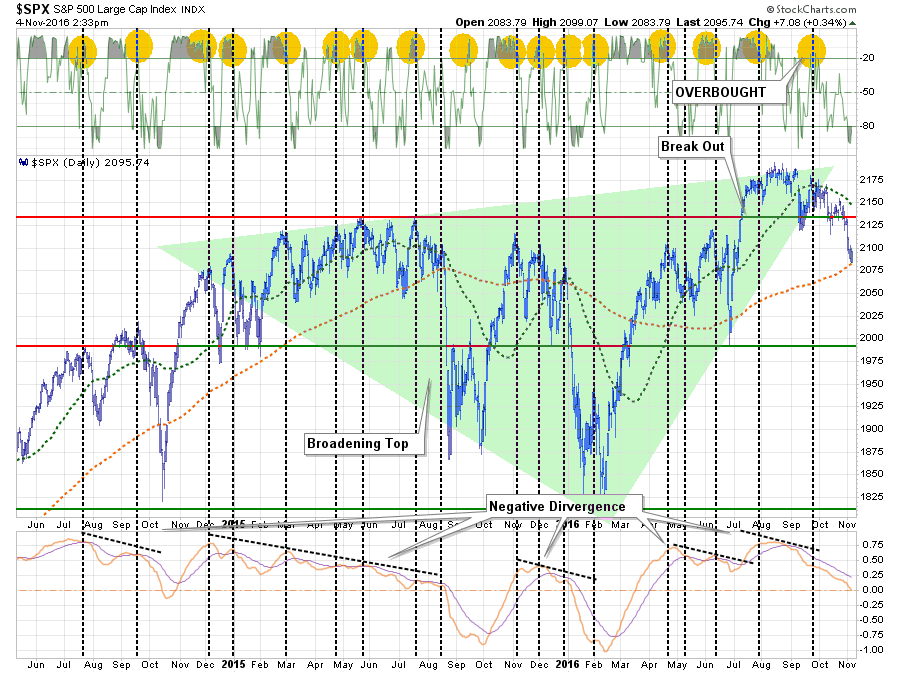
The chart below is a daily chart showing the market currently bouncing off support at the 200-dma combined with a 3-standard deviation move from that short-term moving average. This all suggests a reflexive bounce from oversold conditions is extremely likely.
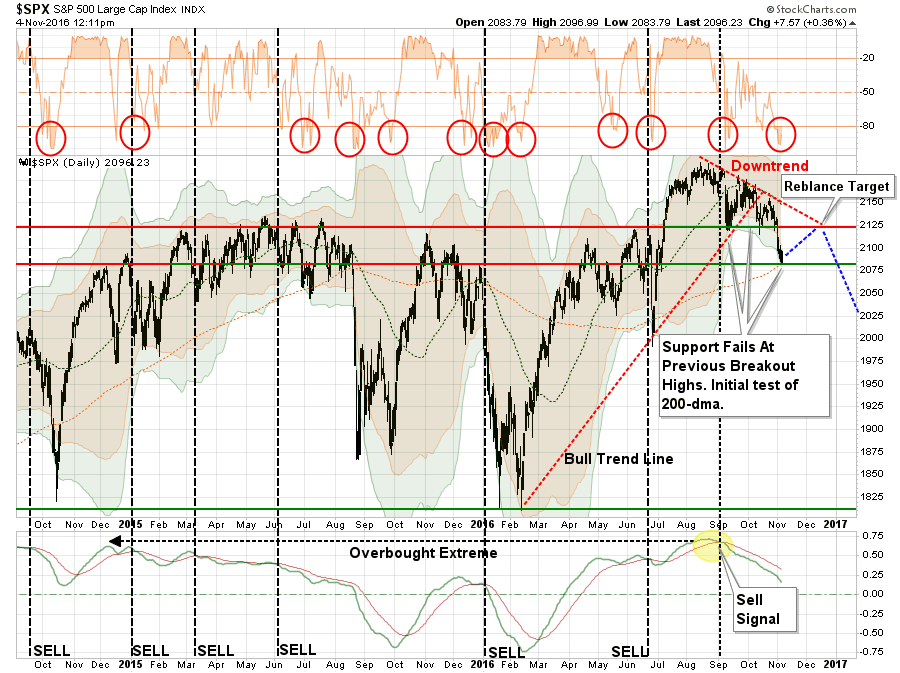
As I have detailed on the chart above, there is a confluence of events currently occurring that suggests further downside risk following the reflexive bounce illustrated by the blue dashed line.
- The downtrend resistance from the previous highs is colliding with the previous support level which now acts as important resistance.
- The 50-dma is also trending downward adding further resistance to price advances in the near-term.
- An important “sell signal” has been registered at fairly high levels and current remains intact.
However, if we step back to a longer-term (weekly) picture we get further evidence of the potential for more corrective action to come.
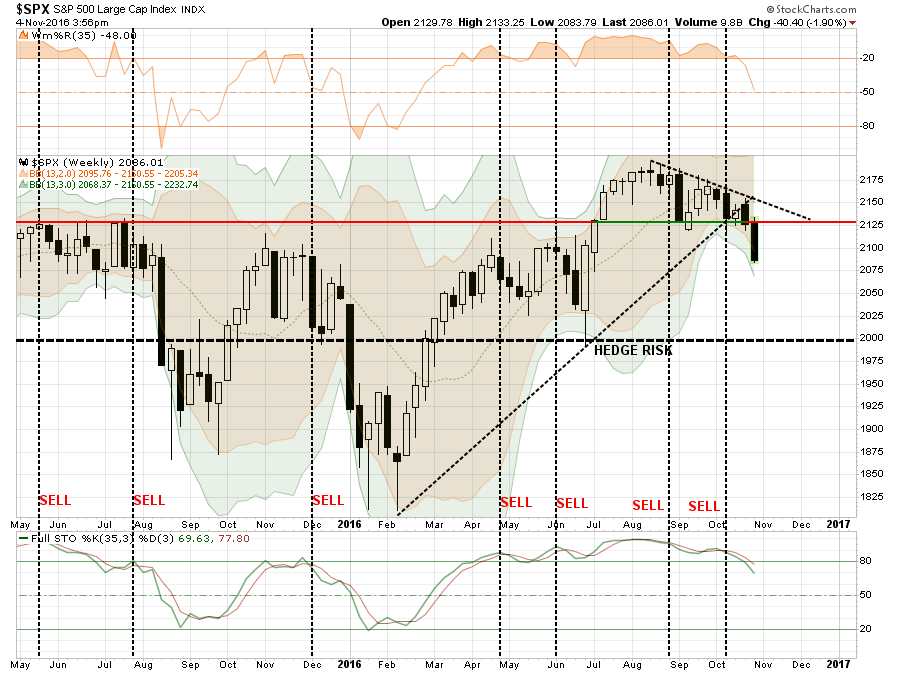
As shown, the sell signals that are currently being registered in the market have typically suggested further deterioration in the markets to come. This supports the idea that any reflexive bounces, particularly post-election next week, should be used to re-balance portfolio risk accordingly.
So, what exactly does that mean? Let me explain.
Gardening Rules For Portfolio Management
I have often equated portfolio management to tending a garden in the past. Have a listen starting at the 3:00-minute mark.
In order to have a successful and bountiful garden we must:
- Prepare the soil (accumulate enough cash to build a properly diversified allocation)
- Plant according to the season (build the allocation based on cycles)
- Water and fertilize (add cash regularly to the portfolio for buying opportunities)
- Weed (sell loser and laggards, weeds will eventually “choke” off the other plants)
- Harvest (take profits regularly otherwise “the bounty rots on the vine”)
- Plant again according to the season (add new investments at the right time)
So, with this analogy in mind, here are the actions to continue taking to prepare portfolios for the next set of actions:
Step 1) Clean Up Your Portfolio
- Tighten up stop-loss levels to current support levels for each position.
- Hedge portfolios against major market declines.
- Take profits in positions that have been big winners
- Sell laggards and losers
- Raise cash and rebalance portfolios to target weightings.
Step 2) Compare Your Portfolio Allocation To The Model Allocation.
- Determine areas requiring new or increased exposure.
- Determine how many shares need to be purchased to fill allocation requirements.
- Determine cash requirements to make purchases.
- Re-examine portfolio to rebalance and raise sufficient cash for requirements.
- Determine entry price levels for each new position.
- Determine “stop loss” levels for each position.
- Determine “sell/profit taking” levels for each position.
(Note: the primary rule of investing that should NEVER be broken is: “Never invest money without knowing where you are going to sell if you are wrong, and if you are right.”)
Step 3) Have positions ready to execute accordingly given the proper market set up. In this case, we are looking for a rally which will reduce the short-term oversold condition of the market and allow for a better opportunity to reduce overall portfolio risk.
IMPORTANT NOTE: Taking these actions has TWO specific benefits depending on what happens in the market next.
- If the market rallies back to resistance, and fails, the actions clear out the “weeds” and allow for protection of capital against a subsequent decline.
- If the rally breaks above resistance, and resumes the bullish trend, then the portfolio has been cleaned up and new positions can be added to participate in the next leg of the advance.
No one knows for sure where markets are headed in the next week, much less the next month, quarter, year, or five years. What we do know is that NOT managing risk in portfolios to hedge against something going wrong is far more detrimental to the achievement of long-term investment goals due to the inability to recover the “time” lost getting back to even.
Sector By Sector
Let’s take a quick look at the 9-major sectors of the S&P 500 to determine the overall strength of the bullish bias.
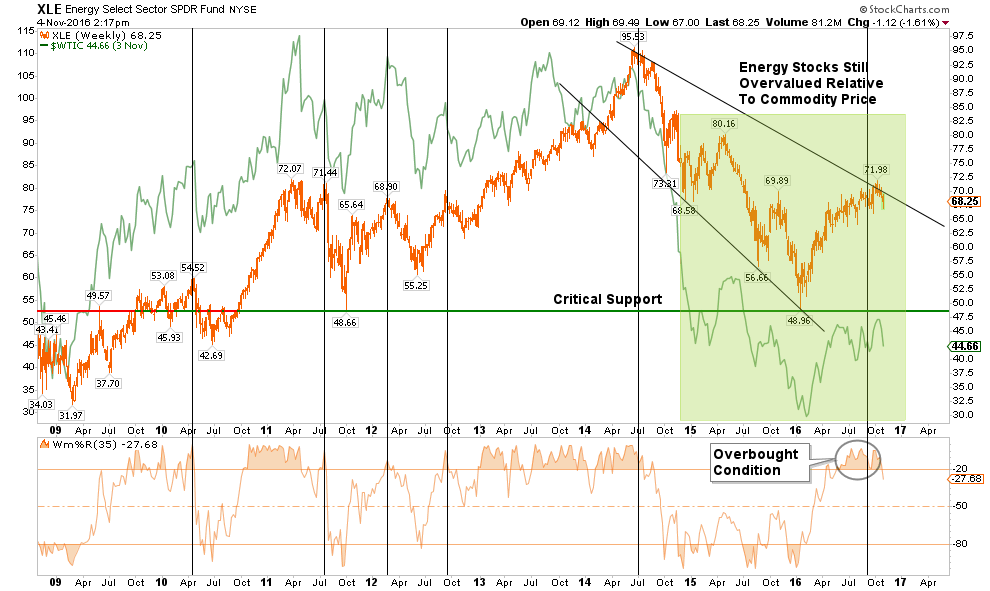
ENERGY
The energy sector is closely tied to the underlying commodity price. Given the ongoing structural dynamics of the commodity, there is still an unrealized detachment between energy sector fundamentals and the markets.
Over a month ago, I warned the OPEC agreement would fail and oil prices would once again approach $40. There is still more correction to occur in this sector so underweight energy exposure is advised for now.
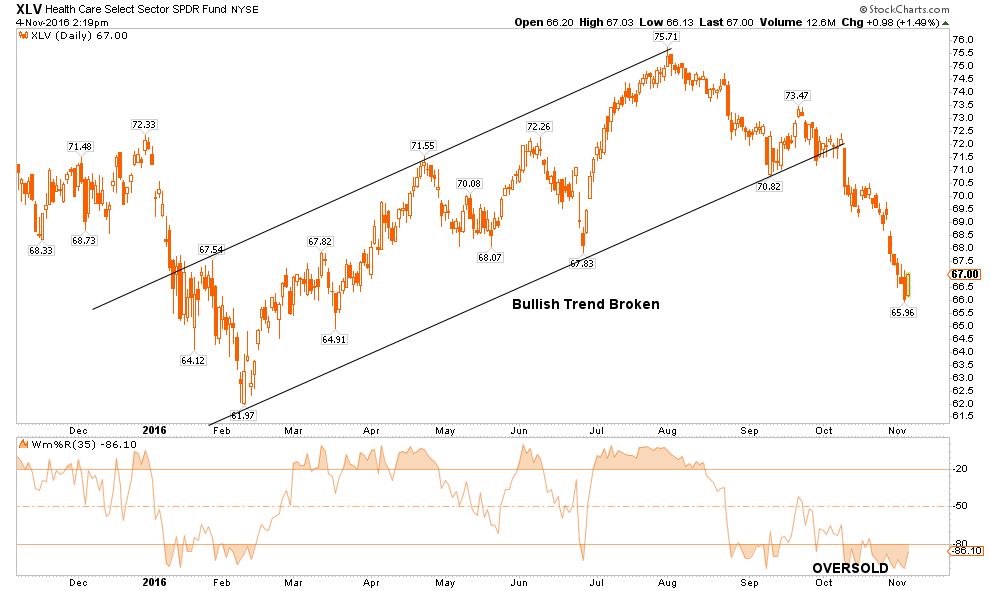
HEALTH CARE
The healthcare sector has been a laggard as of late and has broken down through the bullish trend. With the sector very oversold, there is a reasonable risk/reward setup in the short term for this sector. This is particularly the case as interest rates continue their decline from overbought levels, as I suggested over the last couple of weeks.
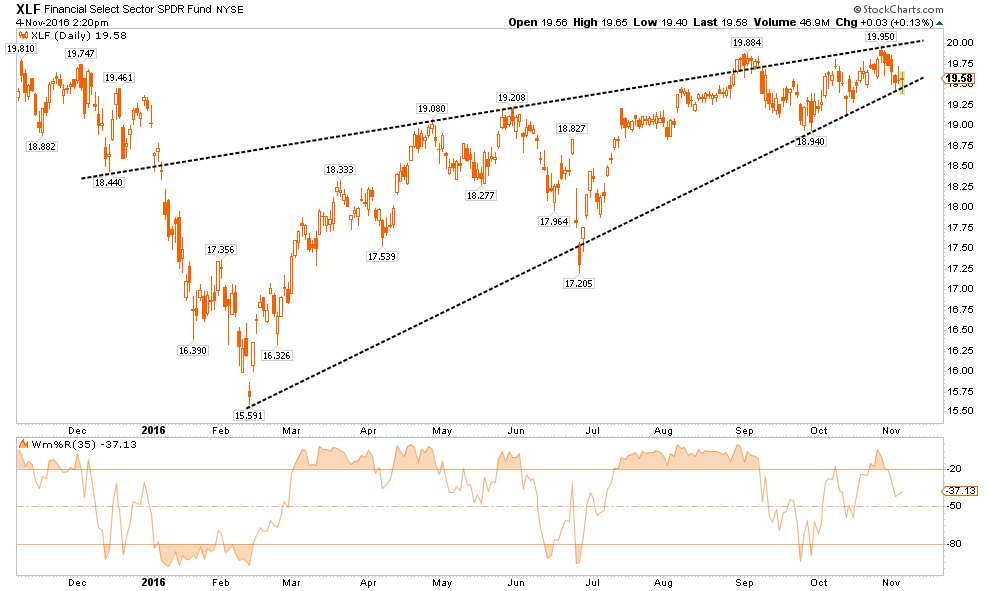
FINANCIALS
Financials continue to be a laggard with respect to overall relative performance, however, the bullish trend line remains intact for now. I suspect this will give way during the continuation of a market correction and a deeper decline will likely occur. I continue to recommend an underweighting of the sector in portfolios for now.
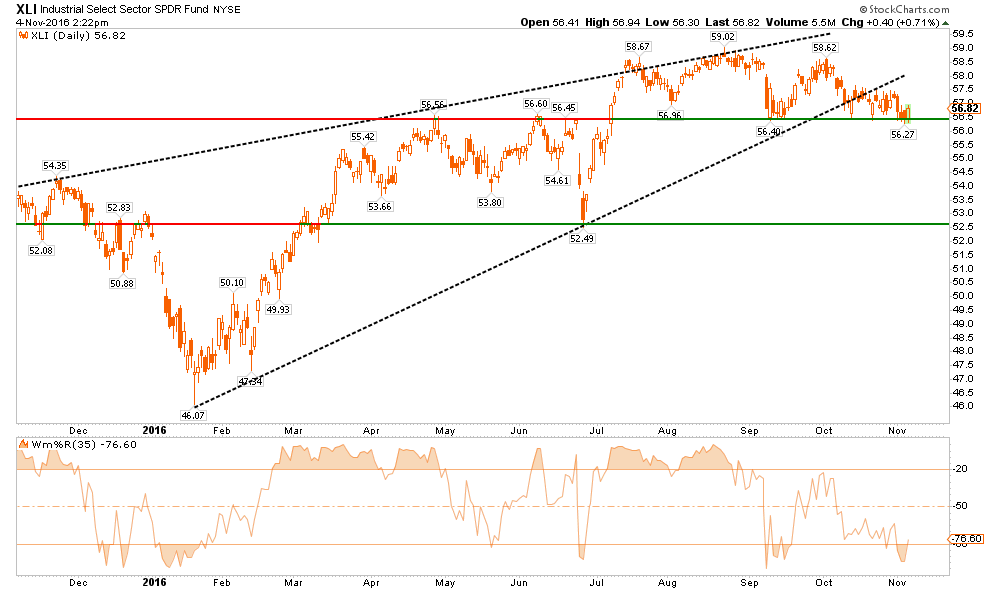
INDUSTRIALS
Industrial stocks, because of the dividend yield, have been a big beneficiary of the “yield chase.” However, this sector is directly affected by the broader economic cycle and with expectations ahead of fundamental realities, risk is high. While the sector continues to hold onto support, I would recommend a reduced exposure to the sector for now until the overall broader market repairs itself. Stops should be placed at the current support level.
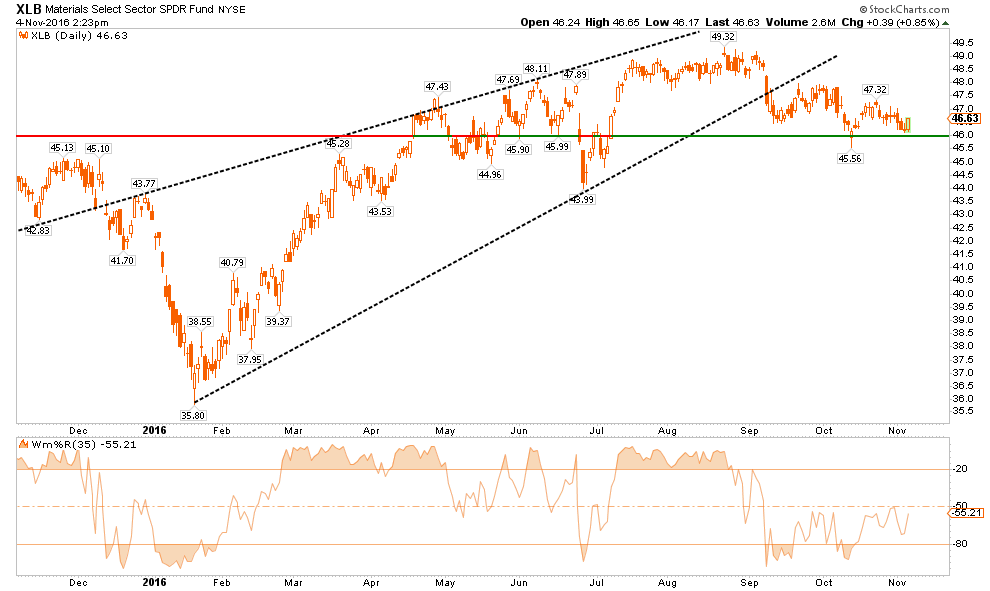
MATERIALS
As with Industrials, the same message holds for Basic Materials, which are also a beneficiary of the dividend chase. This sector should also move to an underweight position for now with stops set at the lower support lines $46.00.
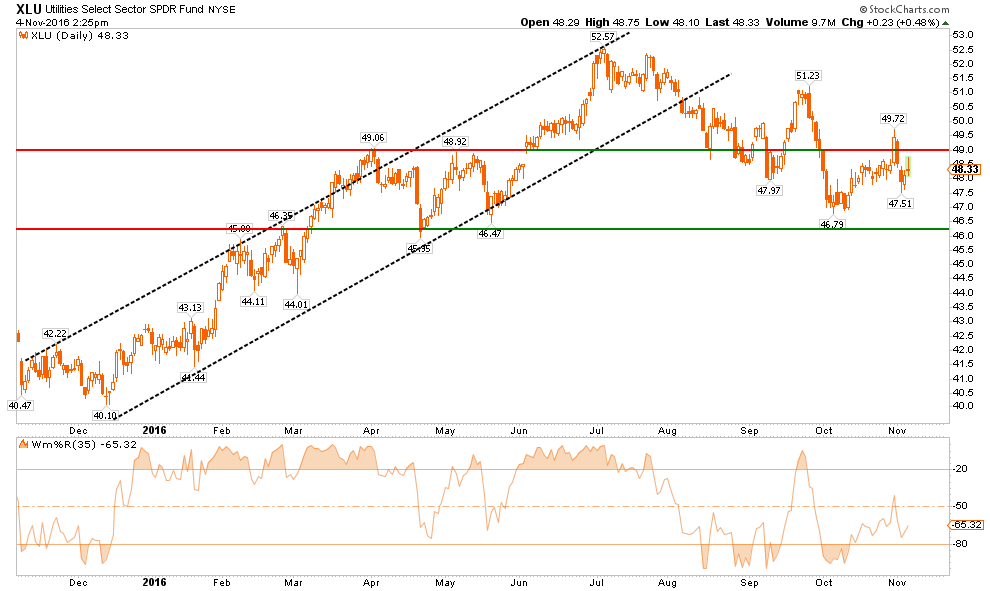
UTILITIES
Utilities have been picking up performance over the last couple of weeks as money begins to rotate back into “safety” plays of bonds and interest rate sensitive sectors. Stops should be set on current holdings at the lower support levels for now and a break above resistance should set the sector up for a further advance.
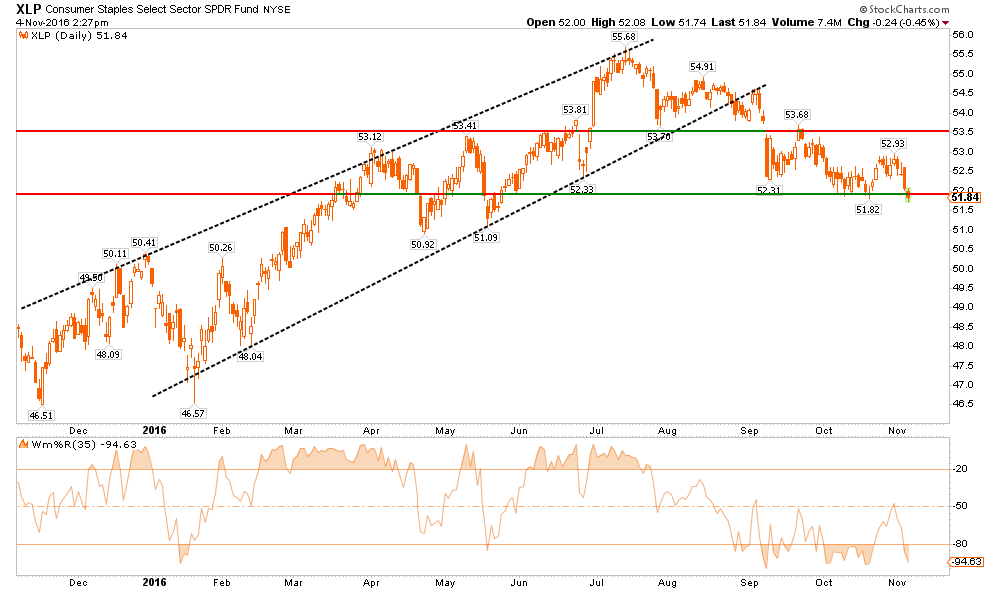
STAPLES
Staples, another beneficiary of the yield and safety chase, broke support at the bullish trend line and is currently oversold. However, with the sector flirting at breaking crucial support, a high degree of caution is advised as “stops” are about to triggered.
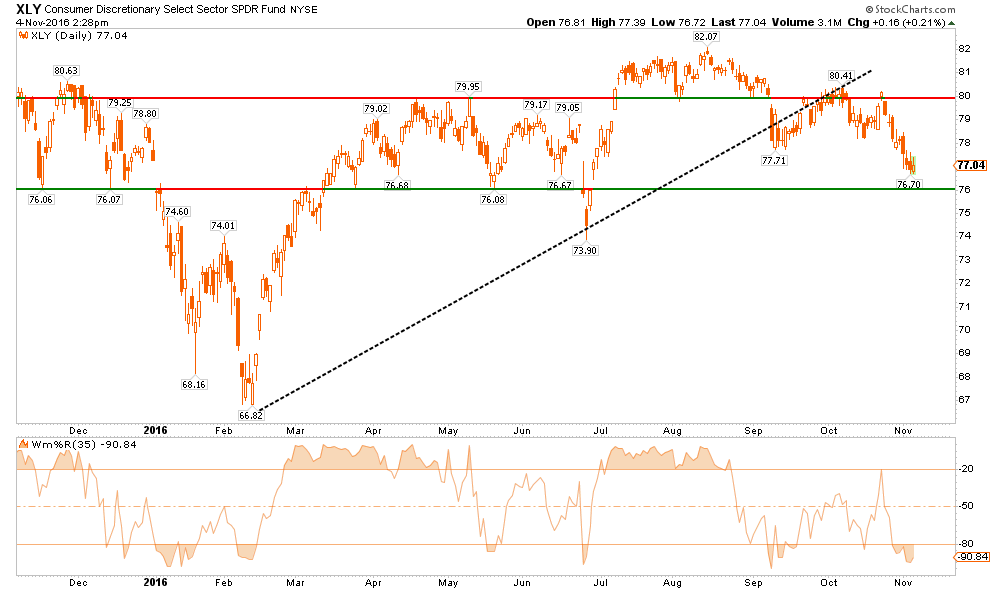
DISCRETIONARY
As goes Staples, so goes Discretionary. Same advice as well. Portfolio weightings should be underweight at the current time with stops set at lower support levels. With many signs the consumer is weakening, caution is advised and stops should be closely monitored and honored.
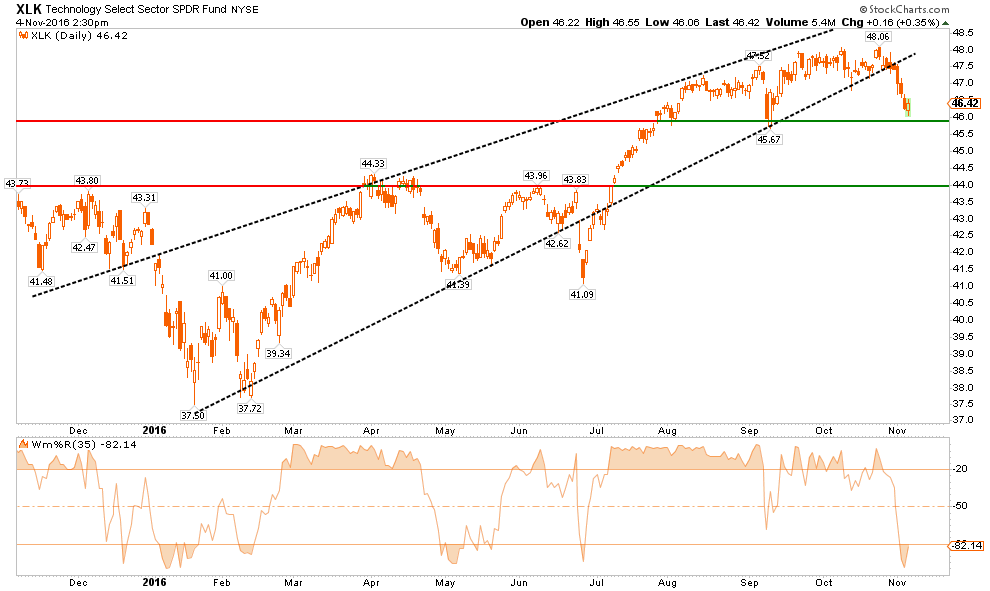
TECHNOLOGY
The Technology sector has been the “obfuscatory” sector over the past couple of months. Due to the large weightings of Apple, Google, Facebook, and Amazon, the sector kept the S&P index from turning in a worse performance than should have been expected.
However, in the last week, the so-called FANG stocks (FB, AMZN, NFLX, GOOG) have stumbled. As earnings and outlooks disappointed, shareholders have awoken to the new normal low growth world and wiped over $100 billion in market capitalization of the four horsemen of the Fed’s wealth creation bubble.
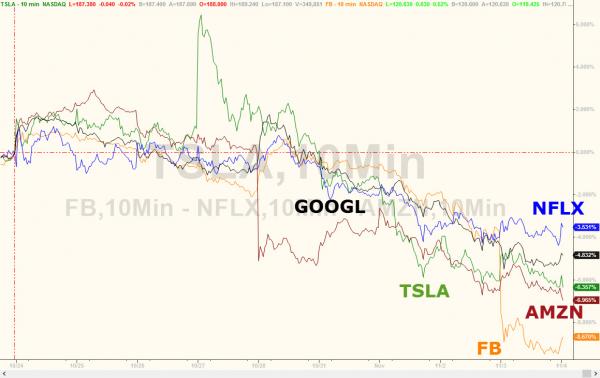
FANGs are now down 8 days in a row..(h/t Zerohedge)
The sector is oversold and very close to breaking important support levels. Weighting should be moved to underweight and stops set just below current support.
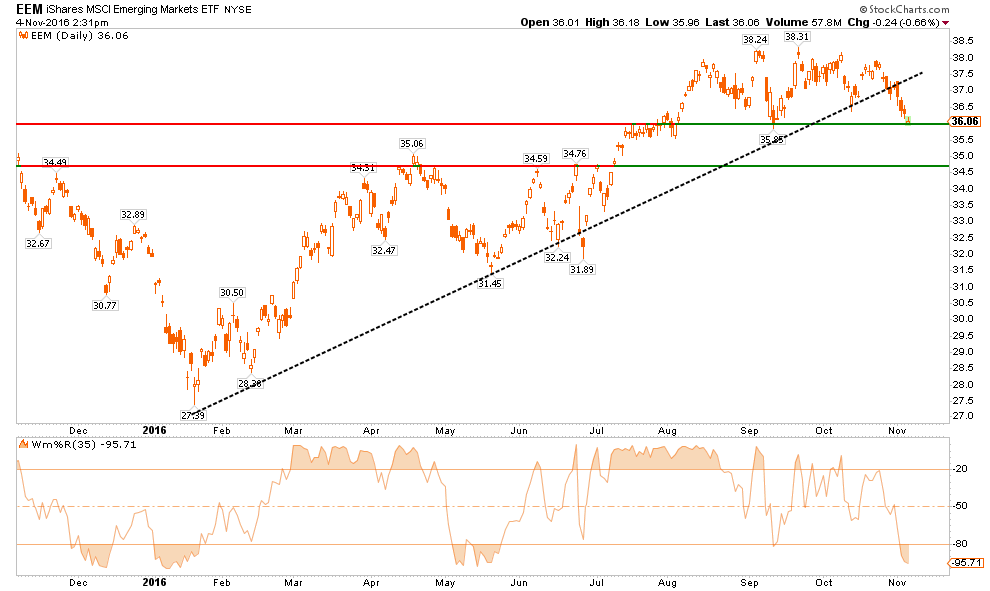
EMERGING MARKETS
Emerging markets have had a very strong performance during the summer but remain in a longer-term downtrend. The strengthening of the US Dollar has started to weigh on the sector and will only get worse the longer it lasts. While the sector is oversold, the majority of the gains in the sector have likely been achieved. Profits should be harvested and the sector under-weighted in portfolios. Long-term underperformance of the sector relative to domestic stocks continues to keep emerging markets unfavored in allocation models for now.
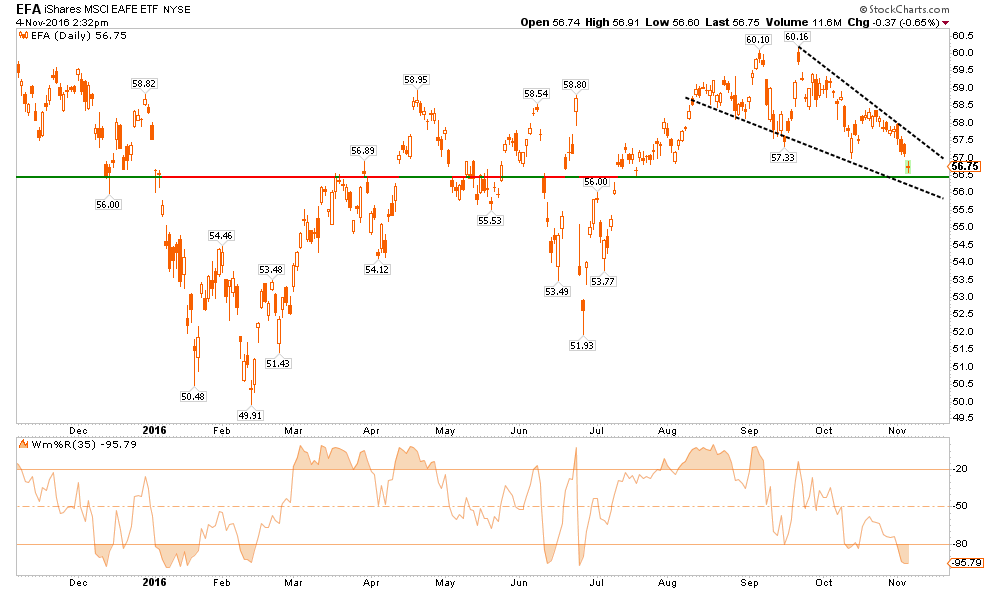
INTERNATIONAL MARKETS
As with Emerging Markets, International sectors also remain unfavored in allocation models. The long-term downtrend remains intact and is currently very overbought. Underweight the sector, take profits, and focus more on domestic sectors for now.
DOMESTIC MARKETS
As stated above, the S&P 500 is now oversold on a very short-term basis and is sitting on top of the 200-dma.However, with longer-term sell signals in place (bottom section of chart) a further decline is likely following a reflex bounce. With the markets failing repeatedly at the 50-dma, the corrective process is likely not over as of yet. Caution still advised for now.
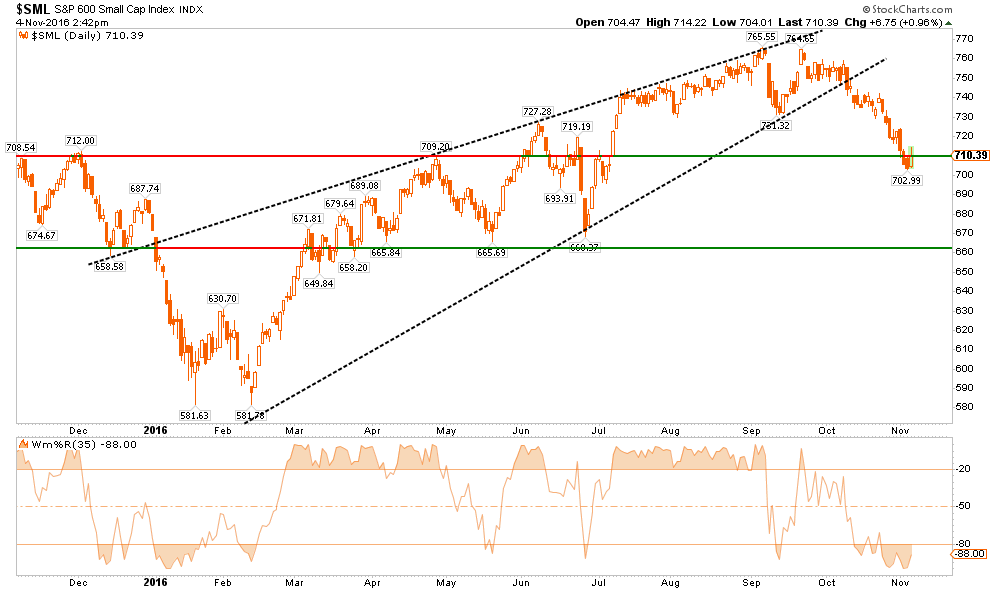
SMALL CAP
Small cap stocks have been grossly underperforming the broader market as economic and earnings weakness tends to show up in these smaller capitalization companies first. With the index breaking down and flirting with important support, caution is advised. Reduce exposure to this sector on any rally until performance begins to improve.
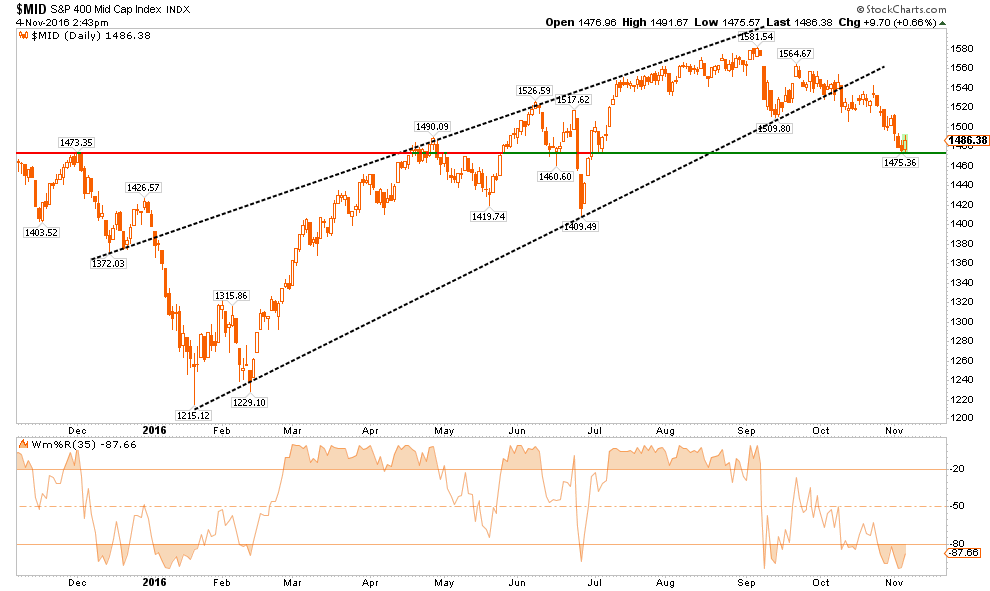
MID-CAP
As with small cap stocks above, mid-capitalization companies are also barely clinging onto critical support and are underperforming the broad market. Reduce exposure to mid-caps on any rally and wait for overall performance to improve.
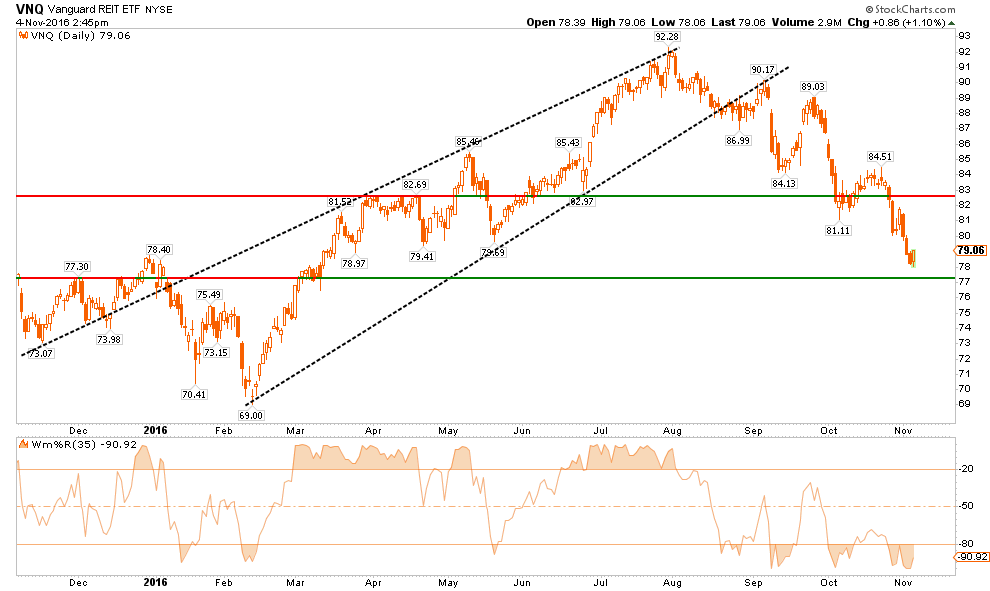
REIT’s
REIT’s have been under a tremendous amount of pressure in recent weeks due to the rise in rates.However, with rates beginning to retrace from more extreme levels, as “risk” rotates back into “safety,” the risk-reward setup to add REIT’s to portfolios is positive. Positions can be added, underweight for now, with stops set at $77.
Overall, in the majority of cases, the risk/reward of the market is NOT favorable. As stated repeatedly throughout this missive, the best course of action currently is to use any rallies over the next few days to reduce portfolio risk accordingly.
If, and when, the market begins to re-establish a more bullish trend, equity risk related exposure can be added back to portfolios.
Just be cautious for the moment.
It is much harder to make up losses than to simply put cash back to work in portfolios.
THE MONDAY MORNING CALL
The Monday Morning Call – Analysis For Active Traders
9 Days Down
My friend Anora Mahmudova had a good piece of analysis on Friday with respect to the 6 and 12-month returns following 9-consecutive down days.
“The S&P 500 on Friday logged its first nine-day losing streak in almost 36 years, but some analysts view declines of eight days or longer as buying opportunities that are usually followed by gains over the next six or 12 months.”
I have modified Anora’s original table to denote the secular period where these instances were occurring.
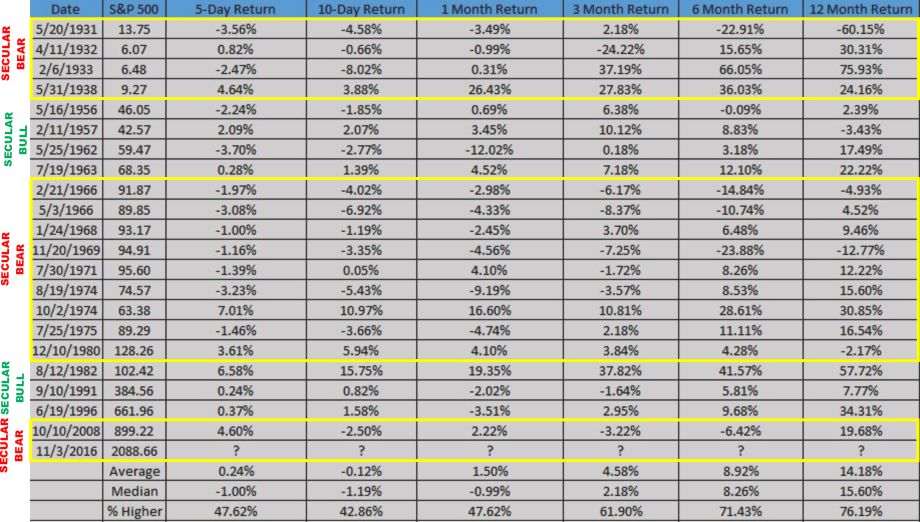
Now, before you go getting all bullish, there are a couple of things that you should note.
First, analysis like this is exceptionally flawed because it obfuscates what happens during the longer-term investment cycle. (Remember, the media says you supposed to be a long-term investor and can’t effectively manage your own portfolio, which is why you should just “index and forgetta’bout it.)
Secondly, I have overlaid these periods (orange dots) over the long term inflation adjusted returns of the market combined with CAPE-10 valuation measures courtesy of Dr. Robert Shiller.
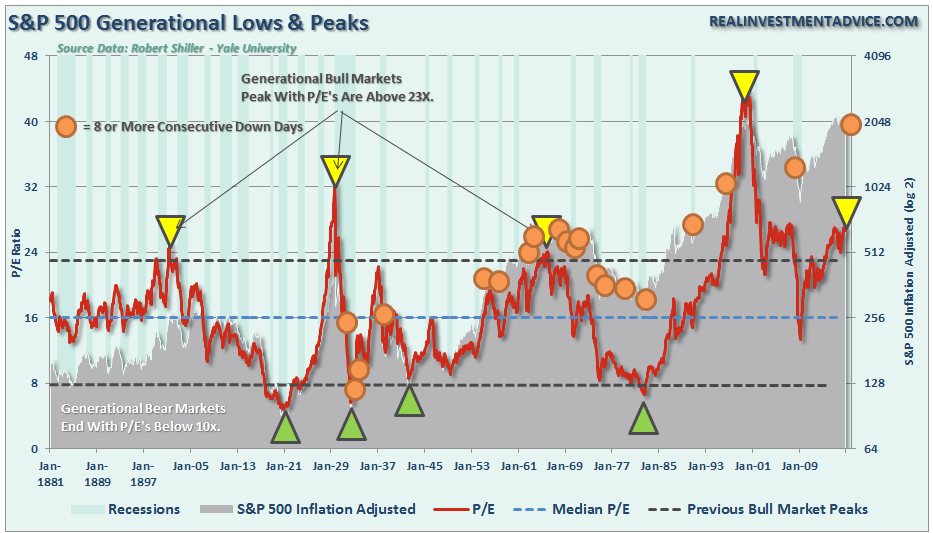
What we find is that long strings of consecutive down days tend to be clustered during long-term secular bear markets and near either short-term or more important major market peaks. Of course, this is not ALWAYS the case, but many times just beyond that 12-month window noted above, bad things tended to happen.
Here is the point, there are many indications the market is currently extremely oversold and likely to bounce next week. Possibly even fairly sharply. However, a bounce is very different than a long-term investable bottom in the market.
If you are a long-term investor that tends not to pay much attention to your portfolio, history suggests that maybe you should.
If you are a short-term trader, there is likely a very tradable opportunity over the next couple of weeks particularly in some of the more beaten down sectors as addressed above.
When investing, it is always context and duration which are critical to portfolio positioning, risk management, and optimal outcomes.
Model Update
S.A.R.M. Sector Analysis & Weighting
Taking a look at individual sectors of the market the deterioration of momentum and breadth continues to become much more evident. The first chart below are the major sectors of the S&P 500 index.
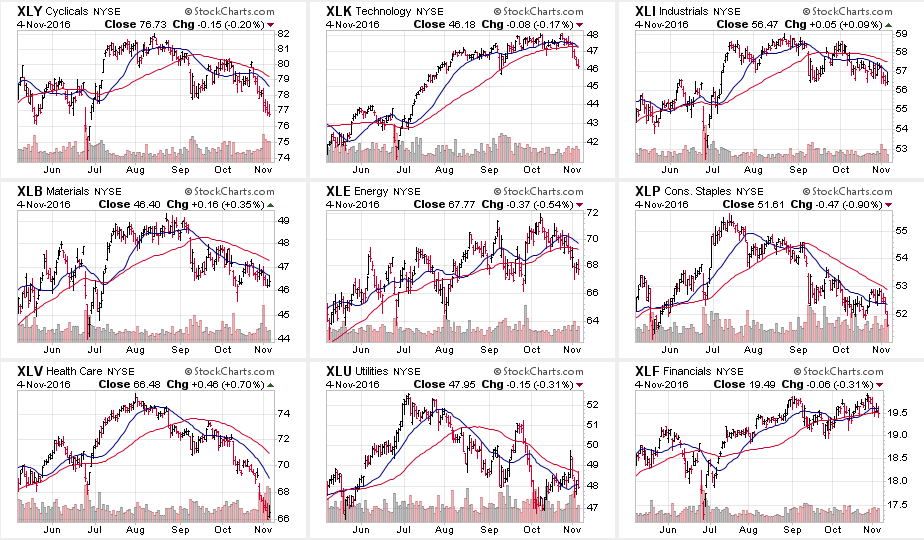
As you will notice 8-out-of-9 sectors, up from 6 last week, have registered short term sell signals with the short-term moving average crossing below the long-term moving average. Furthermore, the majority of the leadership for the current market has come from the technology sector where the momentum of the advance has slowed sharply. However, Utilities picked up some leadership this past week as interest rates declined during the rotation from “risk” to “safety” occurred as expected.
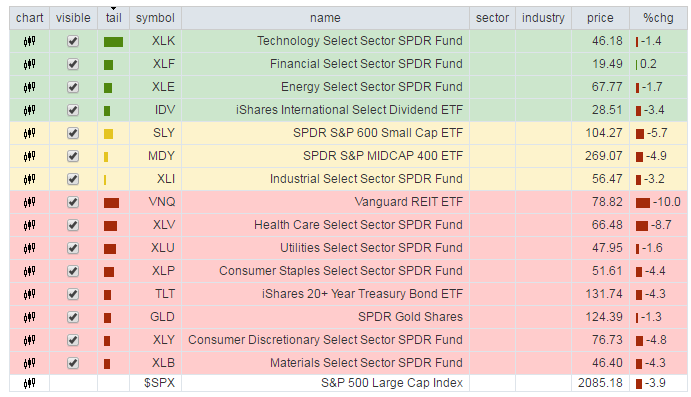
Moving on to other major sectors we find some similar patterns emerging.
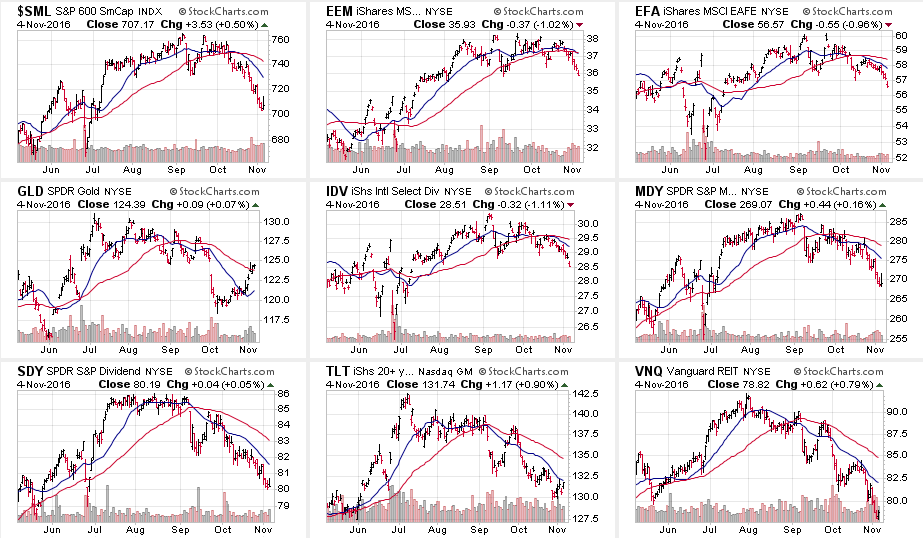
The deterioration is picking up markedly with 9-out-of-9 major indices registering sell signals and seeing deterioration among the previous leadership.
Small Cap, Mid-Cap, Dividend Stocks, and REITs were all hit the hardest as of late. However, as I previously warned, the strengthening of the Dollar is now weighing on the performance of international and emerging market sectors. Caution is advised as the run in Emerging Markets is extremely long in the tooth and is directly impacted by weakness from industrialized economies.
Bonds and Gold strengthened last week as investors began searching for safety.
As I stated last week:
“With the dollar strengthening, interest rates remaining elevated and labor costs on the rise, the risk to corporate profitability is elevated. If earnings season comes in weaker than expected, the recent ability of the market to hold support at bullish levels may fail.”
We are seeing that happen as earnings season progresses. Caution remains a prudent investment stance currently.
I will update this analysis in Tuesday’s Technically Speaking post (click here for free e-delivery)
Let’s take a look at the equal weighted portfolio model.
(Note: This is an equally weighted model example and may differ from discussions of overweighting/underweighting specific sectors or holdings.)
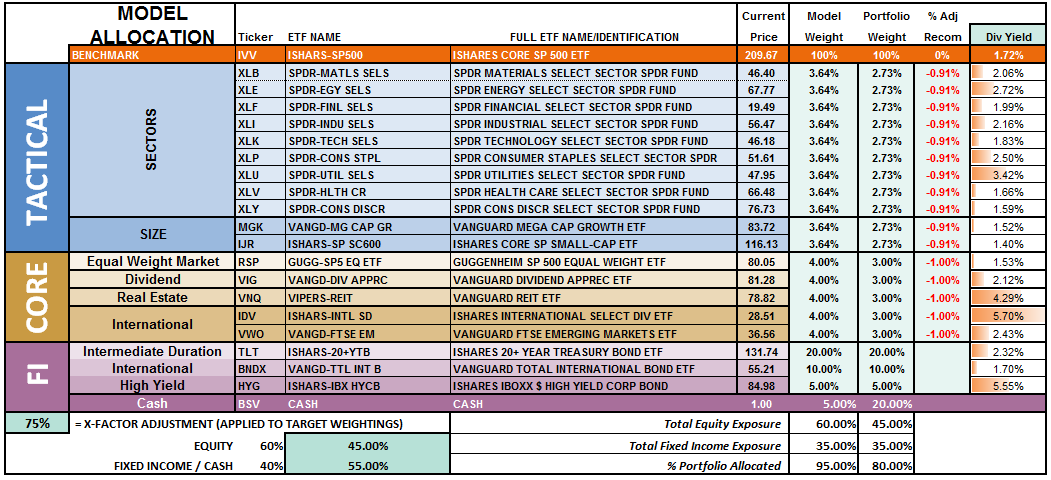
The overall model still remains underweight target allocations. This has been due to the inability of the markets to generate a reasonable risk/reward setup to take on more aggressive equity exposure at this time. However, on a failed rally attempt back to the 50-dma, the ongoing development of sell signals will require a model allocation reduction.
Relative performance of each sector of the model as compared to the S&P 500 is shown below. The table compares each position in the model relative to the benchmark over a 1, 4, 12, 24 and 52-week basis.
Historically speaking, sectors that are leading the markets higher continue to do so in the short-term and vice-versa. The relative improvement or weakness of each sector relative to index over time can show where money is flowing into and out of. Normally, these performance changes signal a change that last several weeks.
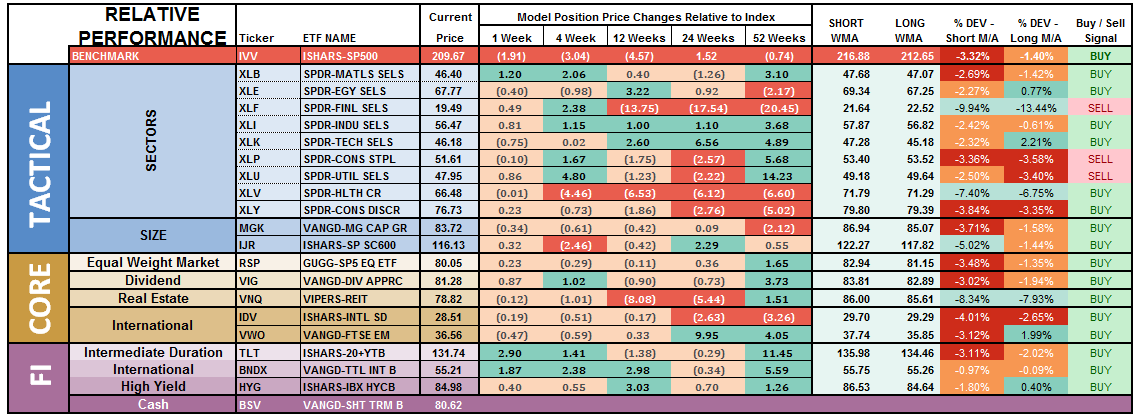
Notice in the next to the last column to the right, the majority of sectors which have previously been pushing extreme levels of deviation from their long-term moving average, have corrected much of those extremes. Furthermore, previously all areas were on long-term buy signals but continued weakness in the markets, combined with loss of momentum, have eroded much of the previous strength.
Financials, Staples and Utilities have now registered, as shown in the last column, a “weekly sell signal.” Importantly, by the time a “sell signal” is registered, the related sector is typically very oversold and will bounce. This tends to be a good opportunity to reduce exposure to that related sector before a continued decline. If the current market weakness continues, expect to see more “sell signals” occurring.
There is a broad deterioration across sector performance which suggests overall weakness in the markets will likely continue in the near-term. Some caution is currently advised.
The chart below is the “spaghetti” chart, via StockCharts, showing the relative strength/performance rotation of sectors relative to the S&P 500. If we are trying to “beat the index” over time, we want to overweight sectors/asset classes that are either improving in performance or outperforming the index, and underweight or exclude everything else.
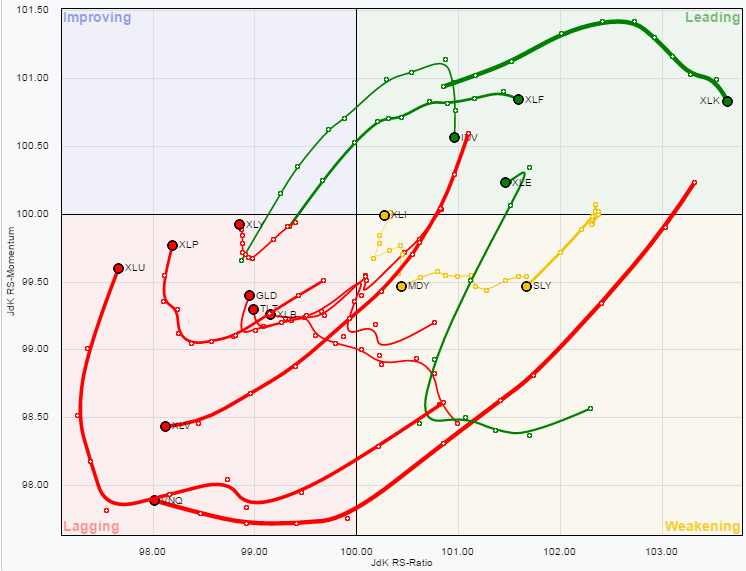
Utilities, REIT’s, Staples, Discretionary, Materials, Bonds, Gold, and Healthcare have remained under pressure this past week. While still underperforming the broad market there are continuing signs of improvement as money rotates from “risk” back towards traditionally “safer” investments.
As I have stated over the last couple of weeks:
“With the rise in rates largely done, sectors with the most benefit from falling rates look reasonable.”
The opposite holds true for those sectors that are adversely affected by a stronger dollar and weaker oil prices. With dollar tailwind still intact, and oil prices grossly extended, profit taking in Small-Cap, Mid-Cap, Emerging Markets, International and Energy stocks seems logical. This recommendation remains from the last couple of weeks and remains salient. “
IMPORTANT NOTE:
There is a difference between improving relative performance and “making money.” All the chart shows above is there are sectors that are either leading or lagging the S&P 500. Improvement DOES NOT mean the sector is making money. It only means the sector is either rising faster than index or not losing as much as the index.
Importantly, not losing as much as the overall index is still losing money.
As I stated last week:
“Lastly, given that a bulk of the sectors remain either in weakening or lagging sectors, this suggests the current advance in the market remains on relatively weak footing.”
I have been recommending taking profits in the Technology sector. This was due to the extreme levels of outperformance of that sector which has begun to fade. The rotation out of technology is likely not complete yet and brings into focus extremely oversold sectors such as Health Care, Utilities and Staples as potential candidates.
The risk-adjusted equally weighted model has been increased to 75%. However, the markets need to break above the previous consolidation range to remove resistance to a further advance.
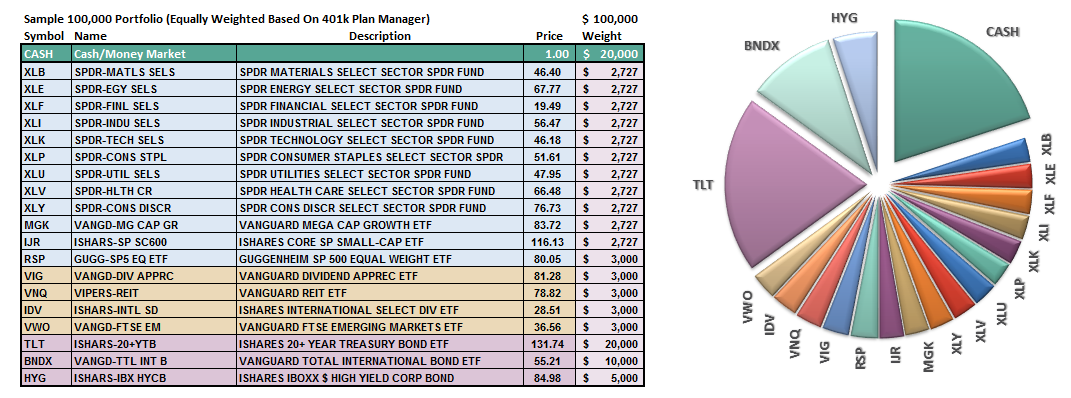
Such an increase will change model allocations to:
- 20% Cash
- 35% Bonds
- 45% in Equities.
As always, this is just a guide, not a recommendation. It is completely OKAY if your current allocation to cash is different based on your personal risk tolerance, time frames, and goals.
For longer-term investors, we still need to see improvement in the fundamental and economic backdrop to support the resumption of a long-term bullish trend. Currently, there is no evidence of that occurring.
THE REAL 401k PLAN MANAGER
The Real 401k Plan Manager – A Conservative Strategy For Long-Term Investors
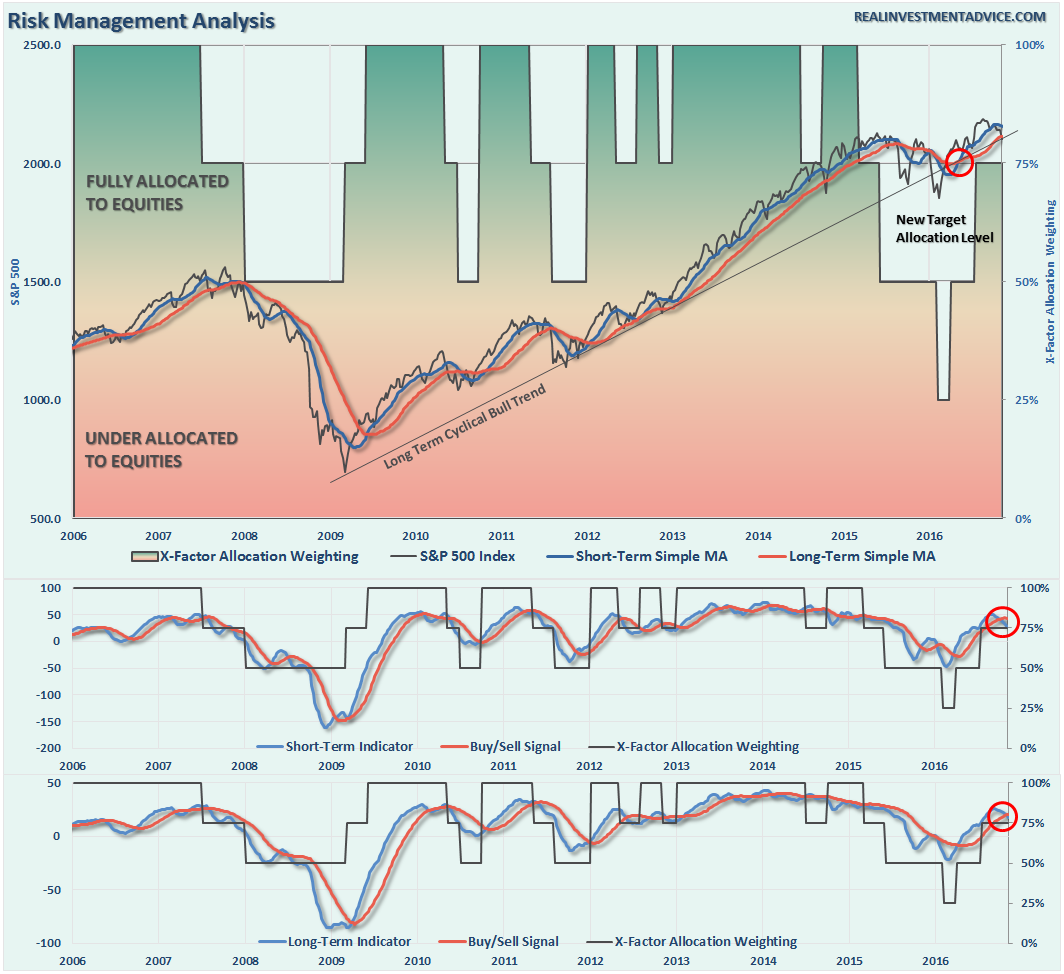
NOTE: I have redesigned the 401k plan manager to accurately reflect the changes in the allocation model over time. I have overlaid the actual model changes on top of the indicators to reflect the timing of the changes relative to the signals.
There are 4-steps to allocation changes based on 25% reduction increments. As noted in the chart above a 100% allocation level is equal to 60% stocks. I never advocate being 100% out of the market as it is far too difficult to reverse course when the market changes from a negative to a positive trend. Emotions keep us from taking the correct action.

9 Straight Declines
The bad news is the market finally broke crucial support at 2125 last week. This now raises alert levels in portfolios particularly as “sell signals” continue to strengthen in the overall market.
By the time breaks of major support occur, and signals are registered, the markets tend to be grossly oversold. This is the case now and suggests a rally will likely ensue next week.
We will want to use that rally to clean up portfolios as discussed in detail in the missive above.
The lower allocations to “risk” in portfolios has lowered volatility and kept principal safe over the last several months. Once we can get past the election and get some clarity when can start making decisions about the “seasonally strong” period of the year.
However, as noted three weeks ago:
“We are dangerously close to triggering a second sell signal, the bottom part of the chart, which will likely coincide with a failed rally attempt over the next week or two. Such an outcome would suggest a weaker market environment in the intermediate term with a high degree of caution required.”
Well, that warning turned out to be correct and remain patient paid off.
Sit tight for now and I will update you on Tuesday.
If you need help after reading the alert; don’t hesitate to contact me.
Current 401-k Allocation Model
The 401k plan allocation plan below follows the K.I.S.S. principal. By keeping the allocation extremely simplified it allows for better control of the allocation and a closer tracking to the benchmark objective over time. (If you want to make it more complicated you can, however, statistics show that simply adding more funds does not increase performance to any great degree.)

401k Choice Matching List
The list below shows sample 401k plan funds for each major category. In reality, the majority of funds all track their indices fairly closely. Therefore, if you don’t see your exact fund listed, look for a fund that is similar in nature.

Disclosure: The information contained in this article should not be construed as financial or investment advice on any subject matter. Streettalk Advisors, LLC expressly disclaims all liability in ...
more


Thanks for sharing