
Johnson & Johnson - Chart Of The Day
Summary
- 4 new highs and up 9.02% in the last month
- Wall Street analysts predict increased sales and earnings
- 96% technical buy signals
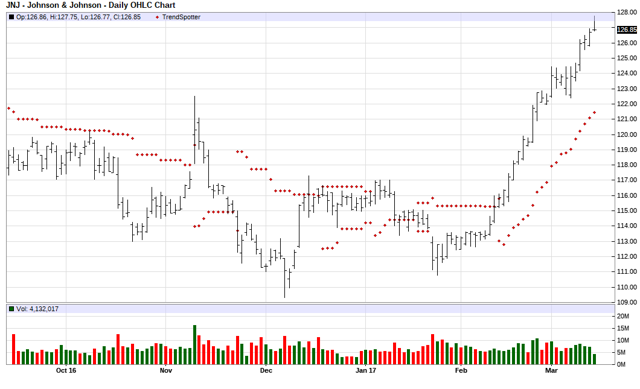
The Chart of the Day belongs to Johnson & Johnson (JNJ) I found the health care stock by using Barchart to sort today's Top Stocks to Own list first for the highest number of new highs in the last month, then again for technical buy signals of 80% or more. Since the Trend Spotter signaled a buy on 2/14 the stock gained 9.05%.
Johnson & Johnson is engaged in the research and development, manufacture and sale of a range of products in the healthcare field. The Company operates in three segments: Consumer, Pharmaceutical, and Medical Devices and Diagnostics. Its Consumer segment offers products for use in the baby care, skin care, oral care, wound care, and women's health fields, nutritional and over-the-counter pharmaceutical products. The company's Pharmaceutical segment provides various products in the areas of anti-infective, antipsychotic, contraceptive, dermatology, gastrointestinal, hematology, immunology, neurology, oncology, pain management, thrombosis, vaccines, and infectious diseases. Its Medical Devices and Diagnostics segment offers electrophysiology and circulatory disease management products; orthopaedic joint reconstruction, spinal care, neurological, and sports medicine products; surgical care, aesthetics, and women's health products. Johnson & Johnson is based in New Brunswick, New Jersey.
(Click on image to enlarge)
The status of Barchart's Opinion trading systems are listed below. Please note that the Barchart Opinion indicators are updated live during the session every 10 minutes and can therefore change during the day as the market fluctuates.
Barchart technical indicators:
- 96% technical buy signals
- Trend Spotter buy signal
- Above its 20, 50 and 100 day moving averages
- 14 new highs and up 9.02% in the last month
- Relative Strength Index 86.51%
- Technical support level at 126.00
- Recently traded at 127.04 with its 50 day moving average at 117.55
Fundamental factors:
- Market Cap $343.73 billion
- P/E 18.89
- Dividend yield 2.54%
- Revenue expected to grow 3.80% this year and another 3.60% next year
- Earnings estimated to increase 4.60% this year, an additional 4.80% next year and continue to compound at an annual rate of 5.91% for the next 5 years
- Wall Street analysts issued 7 buy, 10 hold and 1 sell recommendation on the stock
Disclosure: None.


