
Is The World Coming To The End?
We now live in an interesting time. Every day we wake up with the news about either World Indices make all-time records or bad news about a terrorist attack and nuclear test. Historically, humans have gone through these stages and we were able to withstand all these events. At ElliottwaveForecast, we try to ignore all these events because, at the end, we believe in the Market Nature or code.
The Market or World Indices are not ready for a crash and we have been saying that for a while. $SPX had a chance for a major correction when it reached the 100% extension at 2234.00 area, but the Index hasn’t done anything and keeps going higher. We believe that the Market works as a whole and that looking only at the $SPX or an individual Index is not enough. For the last 6 years, many Elliott wave Theory participants have been calling for a 50% crash and the crash has never happened.
We have been able to stay bullish during this period as we use other tools in our forecast including correlation and also sequences. However, we do understand that nothing runs in a straight line in trading and one day we will get an All-time correction in World Indices. Based on our time and sequence study, we are looking at the 2020-2022 period for the period when we could get major problems in the world and this will be used to justify the all-time World Indices correction.
Many followers may ask why we believe at the year 2020-2022 as the period for major All-Time correction. At Ellitottwave-Forecast.com, we follow a system which includes Elliott wave Theory, cycles, sequences, time, distribution, correlations, and Fibonacci. We do not use Fundamental or sentiment because it provides us neither an actionable trade nor ways to manage the risk.
After providing members with over 7000 charts every month, we discover that majority of news or events happen when the Market reaches the extremes areas, which in our charts is represented by the blue box. The Market follows sequences, cycles and always has a target in each sequence and cycles. Indices are within the Grand Supercycle and only $SPX and $DOW have reached the target, which is the 100% extension from all time low related to 2009. See the chart below.
$SPX Long-Term Chart
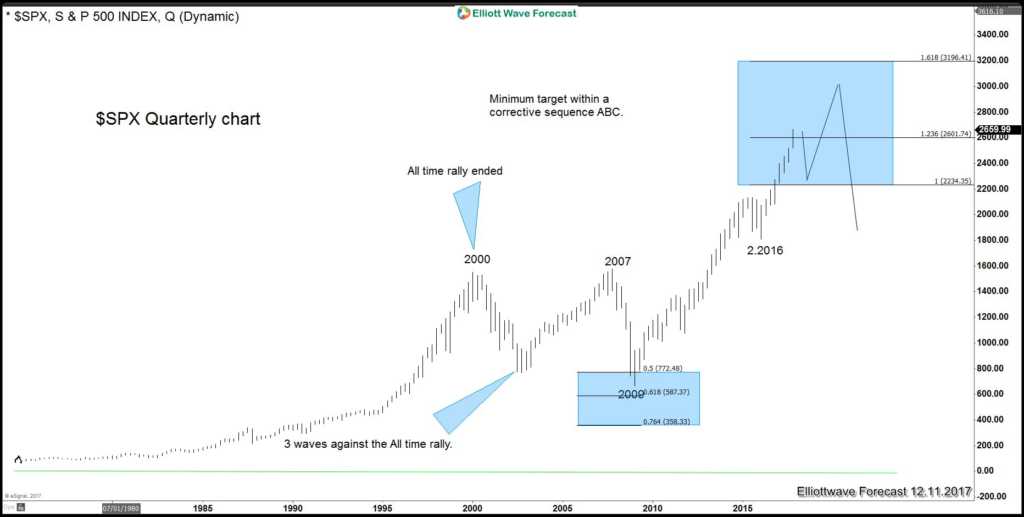
Overall the idea is that the Grand Super cycle has more upside and the upside will come from Super cycle degree which started in 2009. Let's concentrate on 2009 and we can see many World Indices showing an incomplete sequence within this cycle, which started in 2009 and related to 2016. Therefore, even though $SPX and $DOW have reached the 100% extension as shown in the Blue Box within Grand Super cycle, the rest of Indices have not. This means that the Super cycle will push the Grand Super cycle higher.
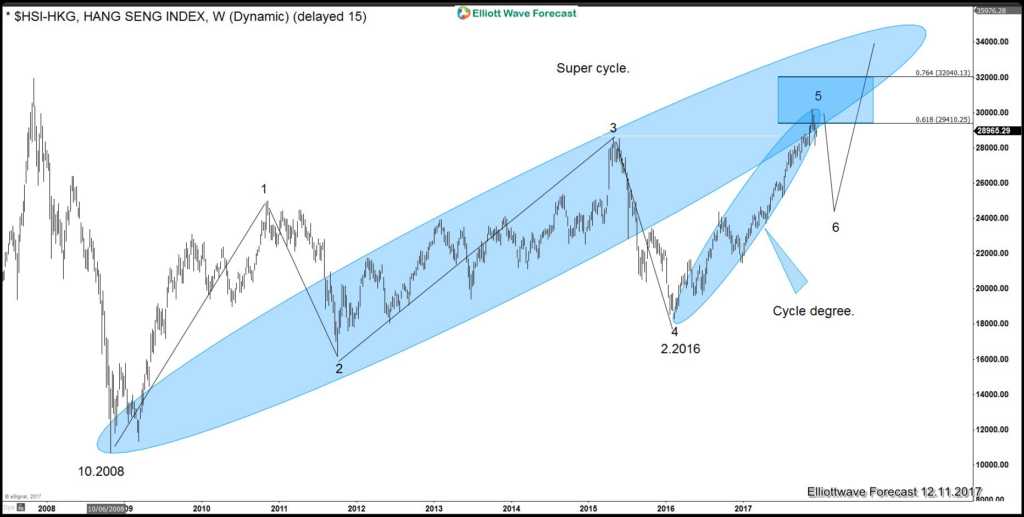
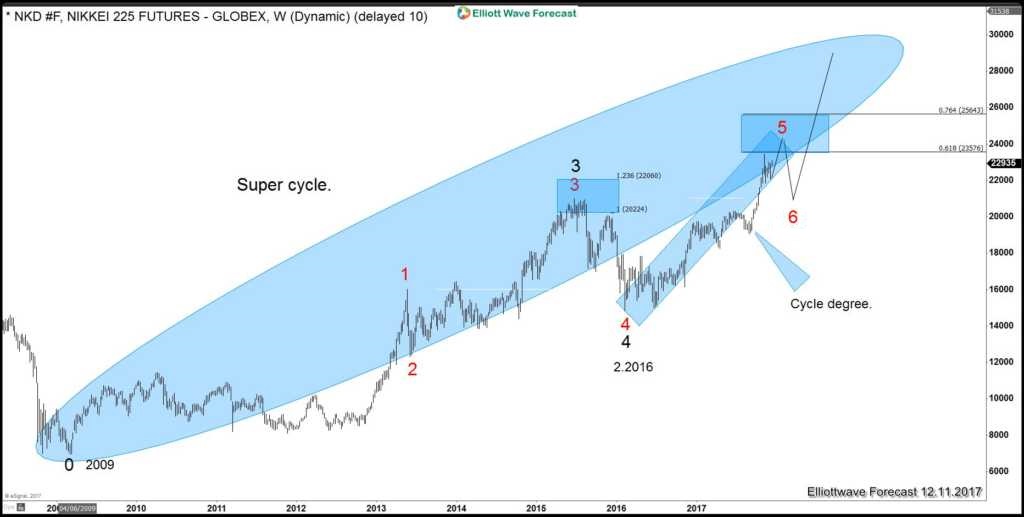
Traders need to understand how to relate the cycles, measure extension targets and be able to adjust when the cycle has ended. As of right now, we do not see any possibility of a 50% crash or correction. All we see is a Cycle degree from 2016 low ending and thus correction will be only towards the cycle from 2016 low with more upside again after. Below charts of Hang Seng Index and Nikkei show incomplete sequence in Super Cycle degree since 2009 and thus further upside is expected.
Hangseng Long Term Sequence Chart
Nikkei Long Term Sequence Chart
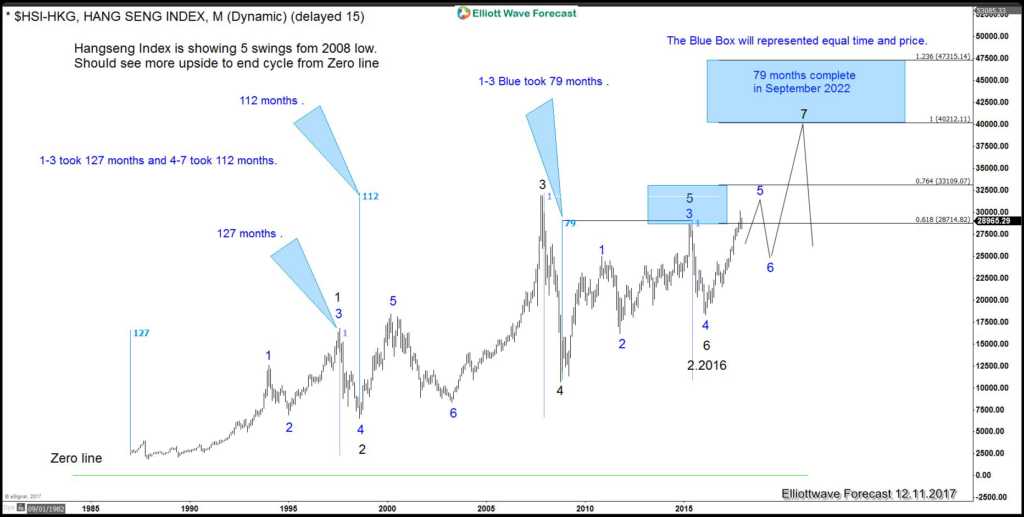
We also see time as an important aspect when it comes to forecasting. In this case, we see still some World Indices shy of the 100% in time. Usually in an ABC or WXY structure, the wave A is equal to C in time-related to B. Similarly, wave W is equal to Y in time-related to X. If we look at the Hangseng chart below, we can see how the Market still needs more time within the Y leg which started at 2008. The first 3 legs higher from 2008 low – 2015 high took 79 months, so the Y leg which started from 2016 low needs similar length of time. This is the reason why we believe that 2020 is the minimum time for the rally in World Indices as it is the minimum travel distance to make a reasonable parity with the first leg. See the chart below for Hangseng time cycles.
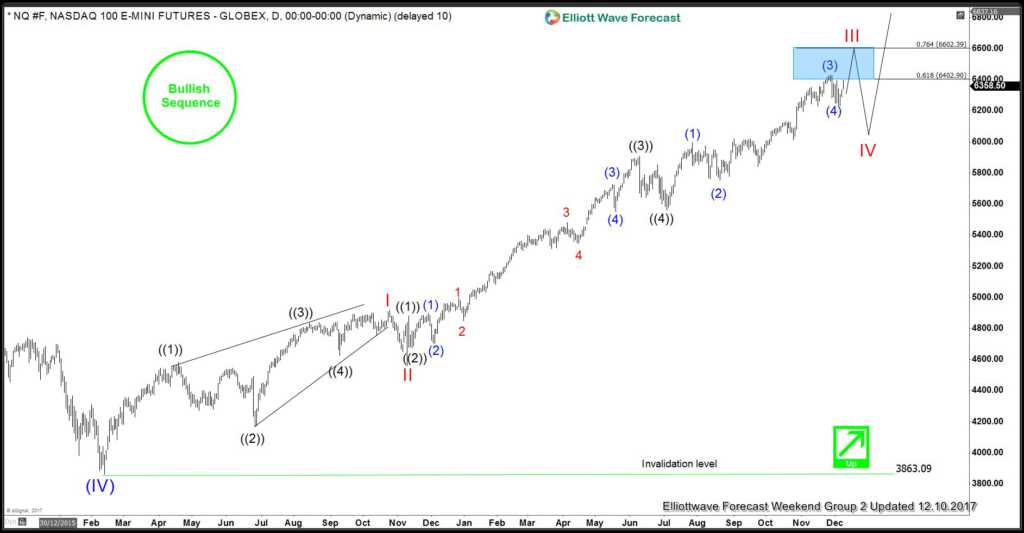
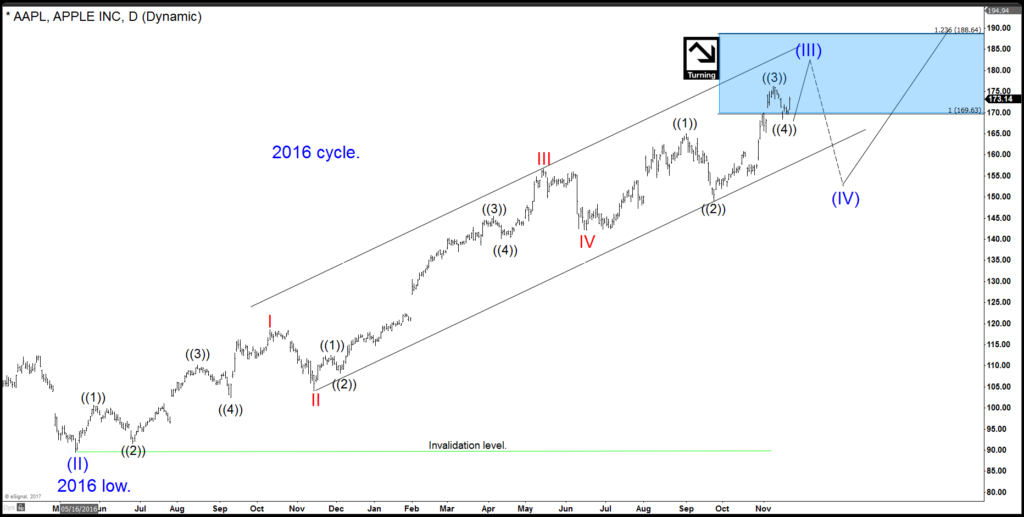
Elliott wave Theory is giving us the idea that only the cycle degree since 2016 will end when the current rally in World Indices ends. This correction will be only to the cycle from 2016 low and not the all-time crash that many people are forecasting. $APPLE further provides us with this confirmation as it is showing a clear 5 waves advance from 2016 low which will provide a 3 waves back. The following two charts of Apple and Nasdaq both show the 5 waves higher from 2016 low.
Nasdaq Daily Elliott Wave Chart
Apple Daily Elliott Wave Chart
As we can see, three instrument have been used to determine 3 cycles degrees and we have used more that 1 Index or instrument to forecast the next few years of trading. As we have explained, we do not only look at 1 Index, we look at the whole Market and we can conclude that nothing significant should happen until 2020-2022 and we will see where the Market stands by then. However, glancing ahead in the political world, the 2020 US Election could be very significant, and it can drive the Market down into a huge pullback. This will all depend on the American Indices and the 1.618 level in the Grand Super cycle. Until then, decent corrections will happen, but nothing very significant such as 50% crash will happen in the World Indices. The strategy will stay the same until then, that is to relate the cycles, degrees and buying the dips. It looks like the World is not coming to the end just yet.
Disclaimer: Futures, options, and over the counter foreign exchange products may involve substantial risk and may not be suitable for all investors. Leverage can work against you as well as for you. ...
more

