
Is Nikkei 225 On The Rise Again?
(Click on image to enlarge)
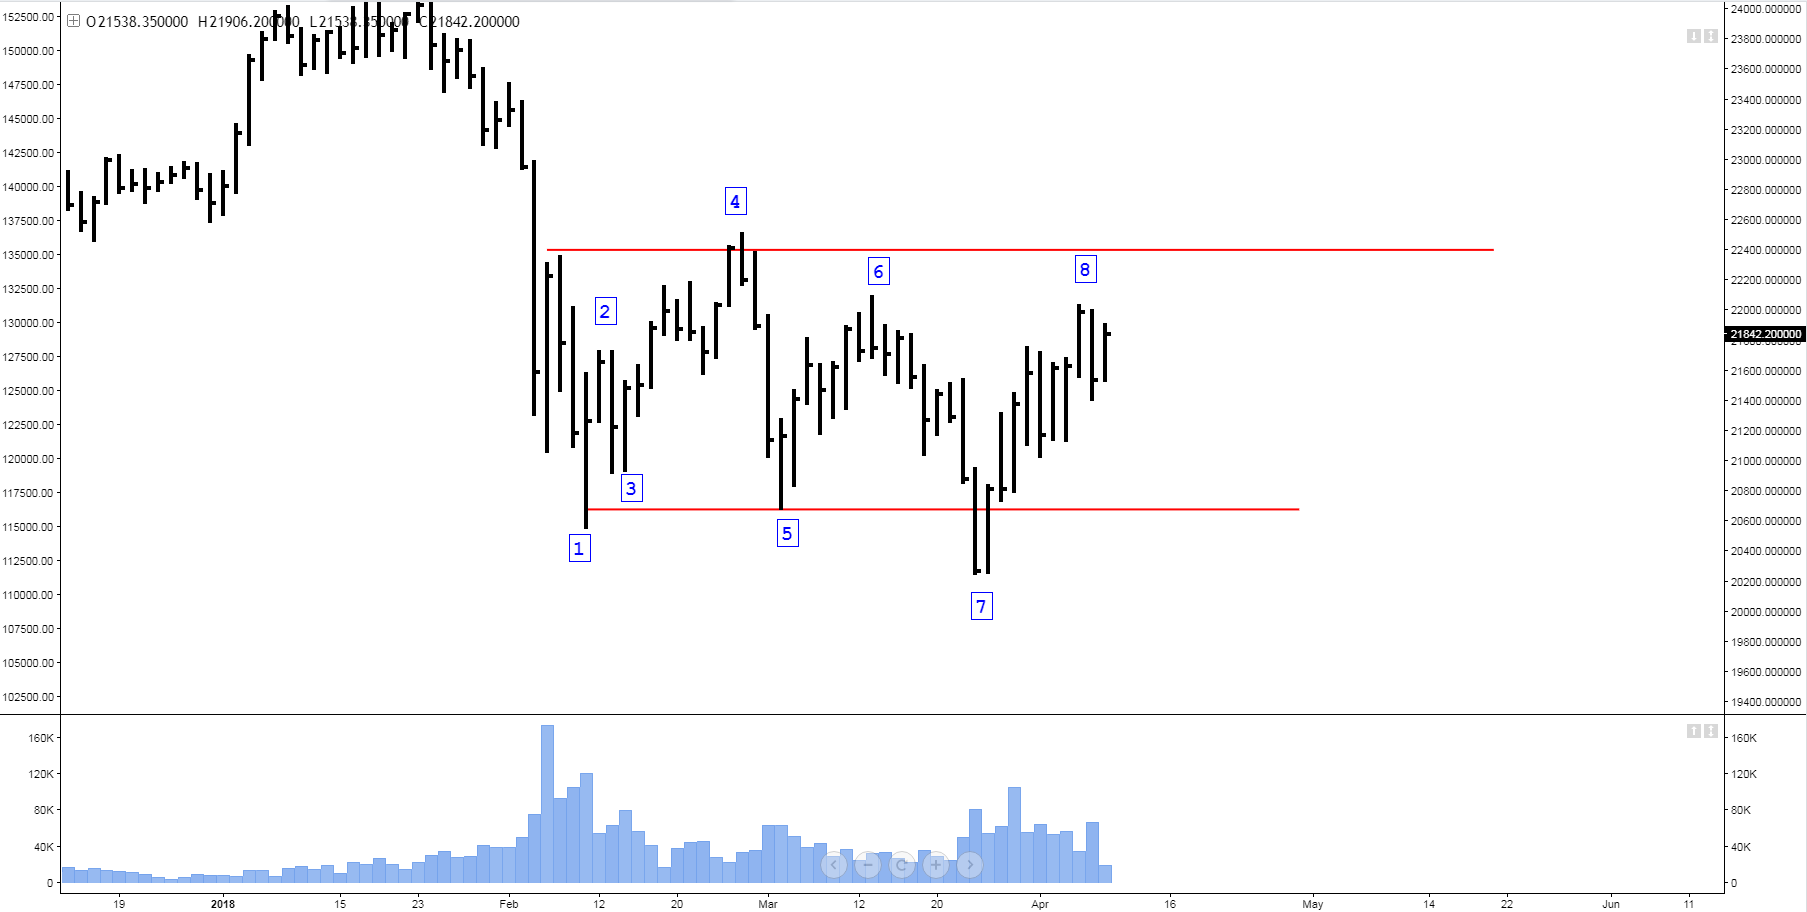
Point 1 – Selling Climax
Point 1 shows a low period of the Nikkei ì225 index with a high volume. The market rapidly loses its support around 21000 and then re-evaluate and closes above the support. The movement described is a bearish trap that generates panic selling on the part of small investor who liquidates their shares in favor of qualified operators. This dynamic is called Selling Climax.
Point 2 -Automatic Rally
The movement in point 2 confirms the hypothesis that on February 9th a selling climax took place. The market reacts rapidly from the low, performing a typical technical rebound called the automatic rally.
Point 3 - Secondary text
The price falls again in the area touched by point 1, but this time the volume is significantly low and the spread of the price bars is smaller than the previous fall, all of these factors point out the sales force depletion.
Point 4
The market rises quickly from the low with a good price progression but with a low volume, indicating the inability of the index to attract new buyers at increasing prices. The price is rejected promptly when it reaches the resistance level and this points out to a probable decline.
Point 5
The index falls violently towards the lows of the period with an increase in volume compared to the rise in point 4, but with the volume much lower than the point 1. Although the spread of the bars downwards is rather wider, the bearish movement does not lead to appreciable consequences by failing to violate the support level at 20.700. The market is now clearly confined to a trading range with an upper limit at 22.300 and lower at 20.700, reporting the temporary balance among buyers and sellers.
Point 6
Nikkei 225 difficulty rises from the lows with decreasing volumes, by failing to target the lower limit of the trading range and anticipating a new possible equity price fall.
Point 7
The index seems completely in control of the sales on March 23 enough to significantly violate the lower edge of the trading range pushed from high volumes. The market regains its lost ground the next day taking itself above the support level and revealing the possibility that in spite of appearances, the bearish candlesticks of 22 and 23 March there were many purchases capable of blocking the price and bring it back into the trading range.
Point 8
The index raises again to the resistance level 22.000 with spread and volumes higher than the previous increase.
Conclusion
The market dynamics reports the possibility that the ongoing process could be a share accumulation by qualified operators. In particular, the fast break up of the support level and the following ascent described in point 7 make me believe that the dynamic between demand and supply is unbalanced at the time in favor of the demand. Therefore, the market once exceeded the resistance levels at 22.000 and 23.300, it could get back up to reach again at the level of around 23.500.


