
Is Mr. Market’s Head In The Clouds?
Historically uncertainty is the markets' foe, but currently the market data suggest a lack of concern. Perhaps Mr. Market’s human nature is getting the best of him.
US equities broke out of the 6-week compression zone led by tech and specifically semiconductor stocks. This propelled the NASDAQ 100 to an impressive gain of almost 5% for the week.
Additionally, the Dow Industrials Index crossed the much anticipated 20,000 milestone, and despite now being up 25% over the past year, the cover of Barron’s this week features the headline, “Next Stop Dow 30,000”!
Mr. Market has a tendency to become optimistic when the calendar year gets off to a good start like we’ve seen in 2017.
In their optimism, equities markets shrugged off slowing growth numbers when the GDP (released Friday) showed slowing growth of only 1.9% versus 3.5% in the third quarter.
Any suggestion of slowing growth should be of particular interest right now considering the fact that the price to sales ratio of the Dow currently sits just under 1.96, or heights not seen since the third quarter of 1999.
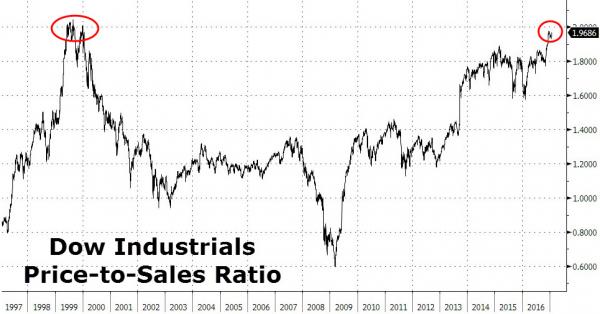
(Chart from zerohedge.com)
Even more curious is how Mr. Market shrugged off the signing of several executive orders that could ignite trade wars, or even provoke real ones.
A clear validation of this concern, this week the China State Media stated on its official website that it is preparing for “practical reality” or a war with the US. This is a result of the Trump administration looking to upend the status quo, including recognizing Taiwan, increasing tariffs on imported goods (that could ignite a trade war), and challenging aggressive Chinese moves in the South China Sea.
There is a consensus of worldwide outrage at Trump's executive order on immigration.
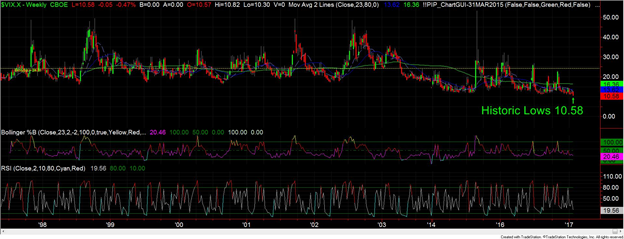
Sentiment as measured by the volatility index (VIX) hit all-time lows, while price action exploded to new highs. Don’t take my word for this, take a gander at this chart which starts in 1997.
Other risk metrics such as risky debt (HYG) versus US Bond (TLT) improved this week as well, favoring a risk on environment.
The takeaway is that applying too much logic to Mr. Market and his actions can be harmful to one’s financial health. Logic and market direction often remain disconnected longer than even the greatest investors can anticipate.
Fortunately, quant models do not suffer from such disconnects. One core quantitative truth in defining persistent trends in the markets, and which is often viewed as a disconnected from logic, is the concept of relative strength (not to be confused with the RSI Indicator). Market leading trends tend to continue longer than many logical measures can explain.
One of our favorite examples of such a relative strength quantitative models is our Sector ETF trading system. This model does not suffer from human frailties of emotion and logic. It simply adjusts according to the actions of Mr. Market and as a result, is already beating the S&P 500 benchmark by 4.2% this year.
We suspect that relative strength methodology to be especially effective going forward.
If one doesn’t have a model they believe in and is a self-directed discretionary trader the key is always the tape and price action. During these changing times it’s critical to be even more vigilant.
Like to learn more about relative strength methodology? Our most recent free training material can be found here.


