
Is Low P/E The Key To Pick Top Performers?
Investors who do their research trying to get the best return in the stock market most probably examine some fundamental parameters which might give them an idea about the chance of a particular stock to be a top performer. One of the most observed value parameters is the price-earnings ratio (P/E), which is the ratio of a company's stock price to the company's earnings per share. Low P/E indicates that the stock could be undervalued since it shows the number of years that earnings could cover the investment.
I tried to find out if there was a correlation between the top 25 S&P 500 performers in the last 52 weeks ending on May 11, to their price-earnings ratio a year ago on May 11, 2017. To do that, I put together in the table below the total return of the best S&P 500 performers (price appreciation and dividend yield) in the last 52 weeks and the P/E ratio a year ago, I used the Portfolio123 screener to get this information.
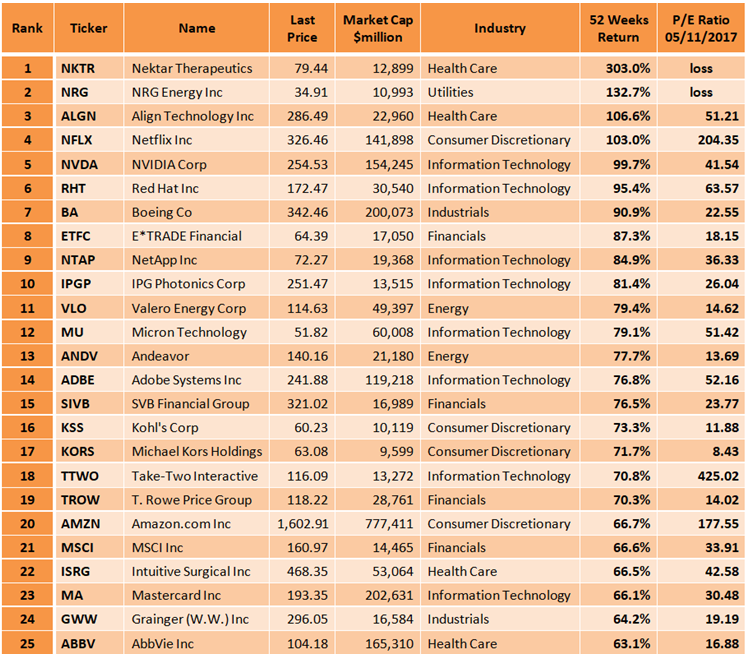

The table above clearly shows that the price-earnings ratio is not very helpful to pick the top performers, at least in one year. While the median of the actual S&P 500 P/E ratio is 21.84, the median P/E ratio of the 25 top performers was on May 11, 2017, much higher at 30.48. What's more, the two top S&P 500 gainers in the last 52 weeks, Nektar Therapeutics (NKTR) and NRG Energy (NRG) did not have P/E ratio on May 11, 2017, since they had suffered a loss on the previous twelve months to that date. Also, Netflix (NFLX), Take-Two Interactive Software (TTWO), and Amazon.com (AMZN) which have given a high return in the last 52 weeks had very high P/E ratio on May 11, 2017. There were only five companies among the 25 S&P 500 top gainers which had a relatively low P/E ratio on May 11, 2017, Valero Energy (VLO), Andeavor (ANDV), Kohl's Corp (KSS), Michael Kors Holdings (KORS), and T. Rowe Price Group (TTWO).
Conclusion
While the price-earnings ratio is a significant parameter analyzing a stock, especially with other parameters which consider growth, it is not the best tool when trying to pick the top gainers at least in a period of one year.


The top performers tend to be newer companies, companies bouncing back due to bad earnings or bad revenue growth, companies that were close to bankruptcy but got new funding, companies with a new product, etc. They are usually not the best stocks to own regularly. Thus PE ratios tend to be not good to nonexistent and balance sheet metrics could look even worse. This usually means gamblers are playing these stocks more than investors.
For investable stocks PE, cash flow, revenue and earnings growth, and balance sheet metrics like debt or lack of it to equity is still very important.