
Increased Market Volatility Resulting In High Quality Stock Outperformance
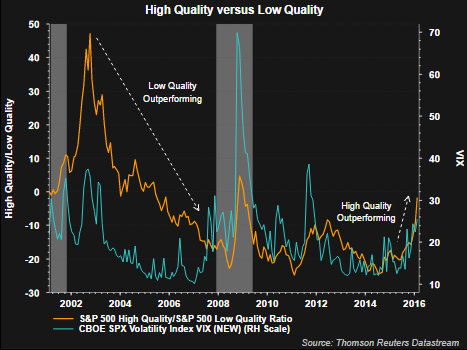
Commensurate with the increase in the market's volatility that began late last year, high quality stock outperformance has accelerated this year. As volatility increases it is common for investors to seek the safety of higher quality equity holdings. The below chart displays the ratio of S&P's high quality index to the low quality index.The S&P Quality Ranking System measures growth and stability of earnings and recorded dividends within a single rank.
- S&P Low Quality Rankings are designed for exposure to constituents of the S&P 500 identified as low quality stocks, i.e., stocks with Quality Rankings of B and below.
- S&P High Quality Rankings are designed for exposure to constituents of the S&P 500 identified as high quality stocks, i.e., stocks with Quality Rankings of A- and above.
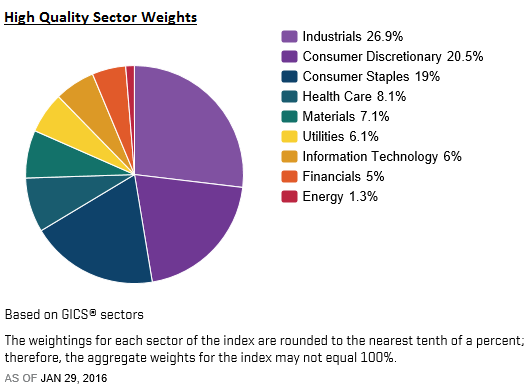
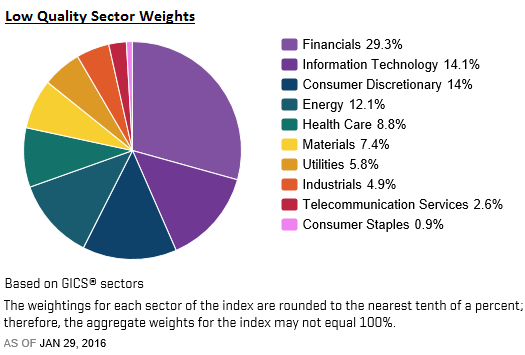
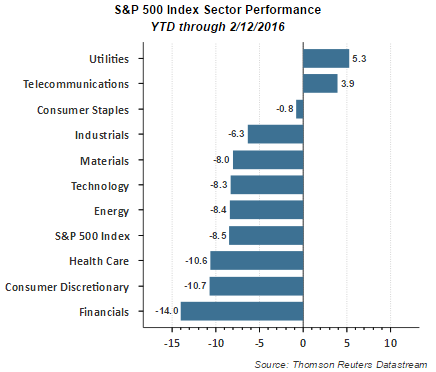
One factor contributing to the underperformance of the low quality index is the large 29% weighting in financials versus 5% in the high quality index. As the last chart below shows, financials have taken it on the chin so far this year.
Disclosure: None.
How did you like this article? Let us know so we can better customize your reading experience.

Comments
Leave a comment to automatically be entered into
our contest to win a free Echo Show.

