
Housing Market Review For January 2018 – Breakdown
The last Housing Market Review covered data reported in December, 2017 for November, 2017. At the time, the iShares U.S. Home Construction ETF (ITB) was still recovering from a small dip caused by an earnings report from Toll Brothers (TOL) that disappointed the market. Housing data were strong and pointed to ongoing bullishness. January launched with strength, and ITB out-performed the S&P 500 (SPY) until January 25.
ITB fell from new 10-year highs while the S&P 500 surged to a new all-time high the next day. Everything fell apart from there. By the end of January, I was salivating over a dip that I previously assumed would not come anytime soon. In another few days, I was writing about the relative underperformance of consumer plays including ITB. I became more wary as ITB confirmed a breakdown from its uptrending 50-day moving average (DMA). The breakdown is undeniable now as the entire stock market suffers a large upheaval.
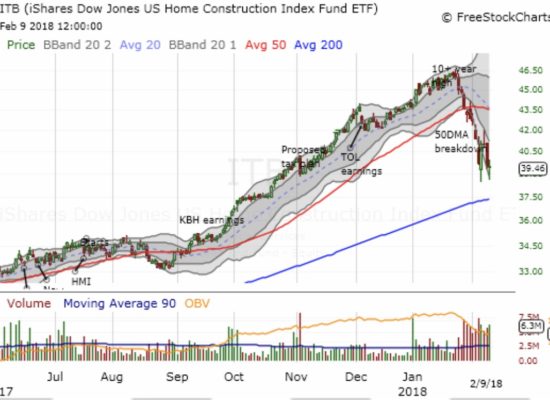
Source: FreeStockCharts.com
Home builders weakened just ahead of the stock market’s sell-off. The breakdown in iShares US Home Construction ETF (ITB) took prices right back to November’s angst over tax reform.
I found a few bargains in the last Housing Market Review. Unrelenting strength in home builder stocks made me ratchet down my expectations for how much trading I would do for the current cycle:
“…the relentless march higher in the price of homes looms as the biggest threat to the health and balance of the market. These out-sized price gains are on a slow collision course with higher mortgage rates. Adjustments in the tax incentives for housing will not help and could further exacerbate the issue (Toll Brothers insists that high-end customers do not care about the tax implicationsof home buying). For these reasons, I will not be as aggressive as usual in buying the dips as I normally would during this season. I will likely stay content with the current small portfolio and trade call options in ITB as the primary way to buy into any dips.”
Now the sector is littered with bargains. I am assuming of course the fundamental story for housing has not changed especially from the demand side. The data from January contain few signs of potential change. As long as rates stabilize soon, my buy-the-dip strategy should deliver a large payoff when the Spring selling season relieves investor angst. However, I think the technical damage in housing-related stocks is severe enough to suggest that the recent multi-year highs will hold as a top for perhaps the rest of the year.
With a deeper dip in home builder stocks, I got back to accumulating select stocks. I am prepared to do one more tranche of buying focused on shares if ITB retests its 200 DMA. Since the last Housing Market Review I have initiated or accumulated larger positions in Meritage Homes (MTH) shares and calls, Lennar (LEN) calls, KB Homes (KBH) calls, ITB calls, and Five Point Holdings (FPH) shares.
Here are some key charts that are of greatest interest to me right now (the upside potential in most of these stocks is substantial given the extent of the current pullbacks and the reversals of breakouts and post-earnings gains):
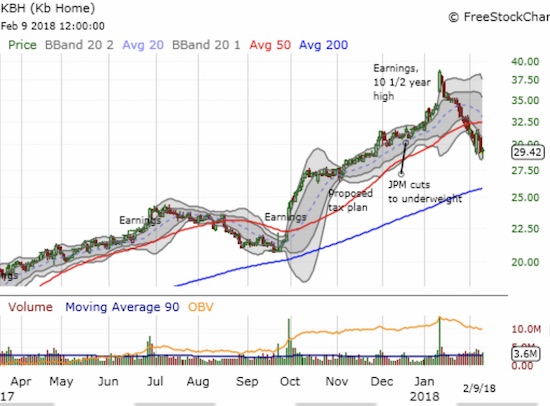
KB Home continues to sell off nearly non-stop from the second day of its post-earnings response.
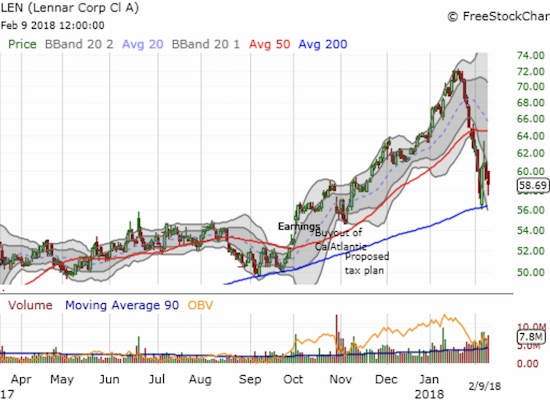
Lennar bounced sharply off 200DMA support. It looks like another test is coming up.
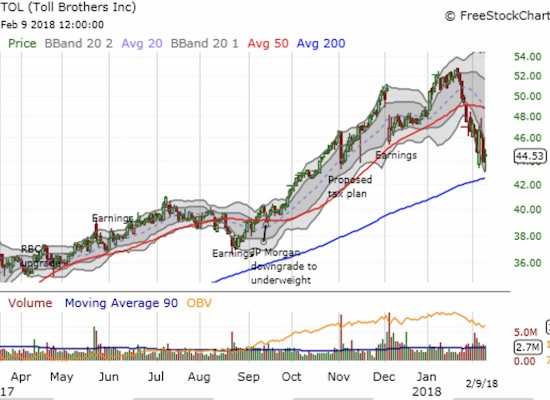
Toll Brothers recovered well from its post-earnings gap down. Now it trades at post-earnings lows and hovers just above its 200DMA support.
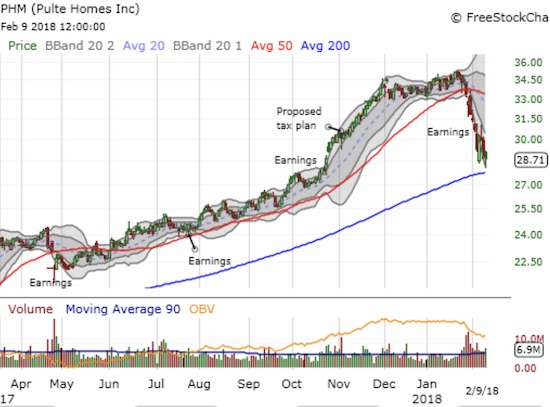
Pulte Homes sold off after its last earnings report and now faces a 200DMA test.
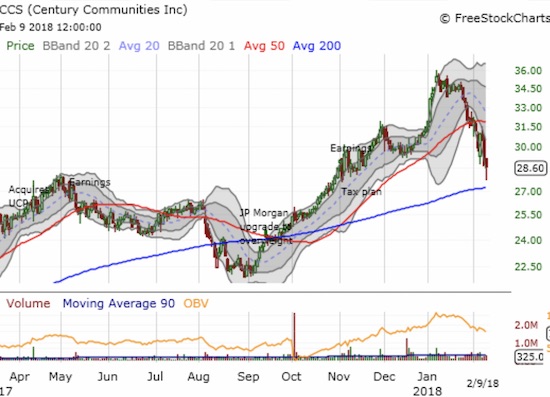
Regional builder Century Communities (CCS) finished reversing its post-earnings gains with a bounce above 200 DMA support.
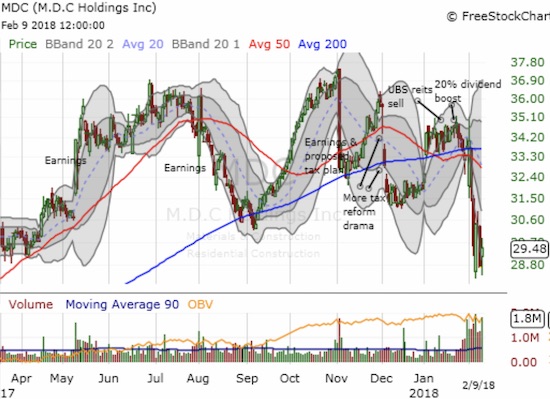
So much for an imminent recovery for M.D.C. Holdings (MDC). The stock looks like its has topped out after a fresh 50/200 DMA breakdown.
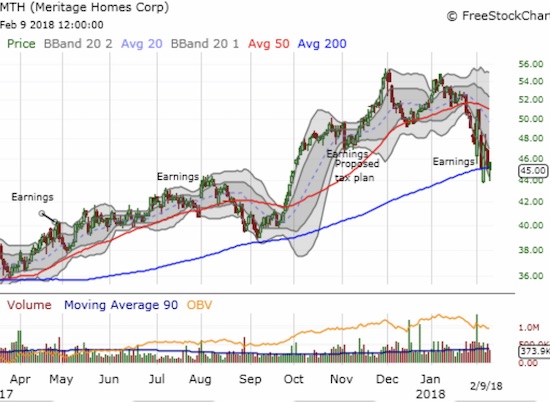
Meritage Homes is struggling to hold onto 200DMA support.
Source: FreeStockCharts.com
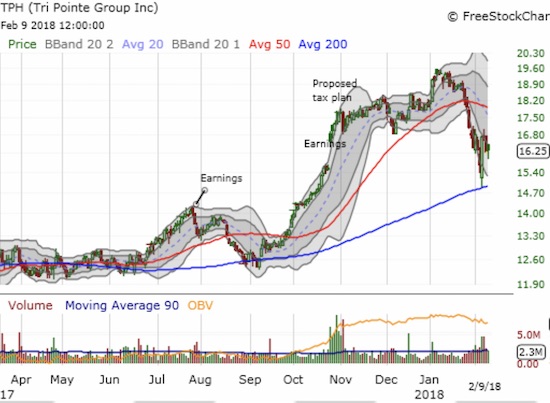
Tri Pointe Group (TPH) bounced sharply off 200DMA support.
New Residential Construction (Housing Starts) – December, 2017
The media headlines on housing starts were all about the declines. However, starts for single-family homes gained year-over-year. The Northeast was the only region which experienced a year-over-year decline, and the West clocked a double-digit gain. So, I was not surprised that the stock of home builders barely moved on the data release that day.
Single-family housing starts for November were revised upward from 930,000 to 948,000. December starts decreased month-over-month by 11.8% to 836,000. On an annual basis, single-family housing starts increased 3.5%, representing a sharp slowdown from November’s 13.5% blistering year-over-year gain.
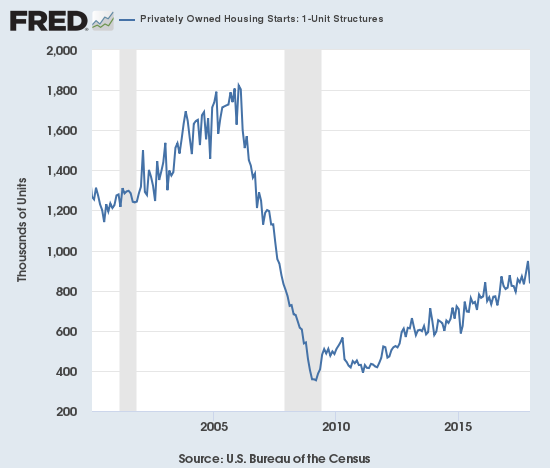
Source: US. Bureau of the Census, Privately Owned Housing Starts: 1-Unit Structures [HOUST1F], retrieved from FRED, Federal Reserve Bank of St. Louis, January 20, 2018.
Housing starts fell steeply from November to December, but the overall uptrend from the lows remained well intact.
After three months of non-dispersed regional changes, dispersion returned for the last four months. The Northeast, Midwest, South, and West each changed -19.0%, 1.6%, 2.2%, and 13.7% year-over-year respectively in December. The West delivered very strong growth once again as builders are clearly in a rush to serve a thirsting market.
Existing Home Sales – December, 2017
The routine description for existing sales is usually sales decline because of a shortage of inventory and sales increase in spite of inventory shortages. For November, the NAR delivered a twist by distinguishing between the upper-end and the rest of the market to help explain how sales can surge despite the parallel relentless increase in prices. The NAR closed out the year observing that sales could have been better if prices were not so high and inventory more available.
“Existing sales concluded the year on a softer note, but they were guided higher these last 12 months by a multi-year streak of exceptional job growth, which ignited buyer demand…At the same time, market conditions were far from perfect. New listings struggled to keep up with what was sold very quickly, and buying became less affordable in a large swath of the country. These two factors ultimately muted what should have been a stronger sales pace.”
For January 2017, existing home sales rose to levels not seen since February, 2007. In February 2017, existing home sales dropped sharply and then rebounded sharply in March to a new post-recession high. Sales declined through the summer and convinced me that the top was in for the year. November proved me wrong with existing home sales climbing to a new 11-year high. For December, existing home sales declined off that high.
The seasonally adjusted annualized sales of 5.57M were down 3.1% month-over-month from 5.78M in sales for November (revised down from 5.81M). Year-over-year sales increased 1.1% which put the growth pattern back on the edge of the deceleration that was in place from April through October: November 15.4%, December 0.7%, January 3.8%, February 5.4%, March 5.9%, April 1.6%, May 2.7%, June 0.7%, July 2.1%, August 0.2%, September -1.5%, October -0.9%, November 3.8%. The prospects for the Spring selling season still look good. Note that the impact of tax reform remains a wildcard as the NAR remains concerned:
“…improving the new tax law is a top priority for Realtors® in 2018. Especially in high-cost, high-taxed markets, there’s still big concern that the overall structure of the final bill diminishes the tax benefits of homeownership in a way that would adversely affect home values and sales over time…As the housing market adjusts to the new law, Realtors® will be listening to their clients and communicating to lawmakers ways to ensure owning a home is truly incentivized in the tax code.”
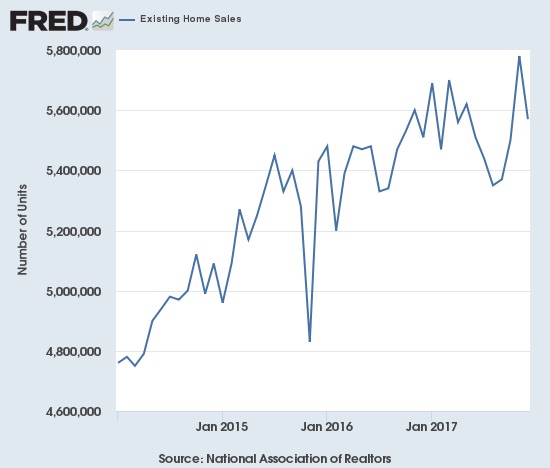
Source: National Association of Realtors, Existing Home Sales© [EXHOSLUSM495S], retrieved from FRED, Federal Reserve Bank of St. Louis, February 8, 2018.
Existing home sales came down sharply off a multi-year high (recall that the NAR no longer makes data available before 2013. For more historical data to 1999 click here)
The share of sales going to first-time buyers jumped backed to 32% from 29% in November. This share was also 32% a year ago. Recall that September was the first time in two years where the share dropped below 30%. This return of first-time buyers throws doubt into the NAR’s claim in the previous report that investors are crowding out first-time homebuyers. The NAR left this factor out when describing the challenges faced by first-time homebuyers:
“Rising wages and the expanding economy should lay the foundation for 2018 being the turning point towards an uptick in sales to first-time buyers…However, if inventory conditions fail to improve, higher mortgage rates and prices will further eat into affordability and prevent many renters from becoming homeowners.”
The average share for first-time homebuyers for 2016 was 35%. The NAR’s 2017 Profile of Home Buyers and Sellers reported an average of 34% for 2017. Investors purchased 16% of homes in December. Investor sales averaged a share of 15% in 2017 and 14% in 2016. Since these sales increased month-over-month alongside an increase in first-time homebuyer share, it is even more difficult to argue that investors are crowding out first-timers.
The absolute level of inventory of existing homes fell year-over-year for the 31st straight month. During November’s press conference, the NAR noted that October set a record low absolute and relative inventory level across all Octobers since data collection started in 1999. Recall that during the June press conference, the NAR talked about a housing crisis in supply in some housing markets. The supply crisis just deepened as the 3.2 months of supply at the current sales rate represents the lowest level of inventory since the NAR started tracking the data in 1999.
The 1.48M homes for sale represented a 10.3% decrease from the previous December and an 11.4% decrease from November’s 1.67M. The string of year-over-year declines is remarkable: for example, starting from 2016…August -10.1%, September -6.8%, October -4.3%, November -9.3%, December -6.3%, January -7.1%, February -6.4%, March -6.6%, April -9.0%, May -8.4%, June -7.1%, July -9.0, August -6.5%, September -6.4%, October -10.2%, and November -9.7%. These are the declines of an increasingly dysfunctional market that, as the NAR continues to imply, is driving prices to levels that will be hard to sustain without a dramatic improvement in the financial standing of potential home buyers.
For November, the regional areas experienced sales pivoting around flatline: Northeast -2.6%, Midwest 1.5%, South 3.1%, West -0.8%. As usual, regional sale fluctuations had no relationship to the on-going price run-ups. All regions logged substantial year-over-year jumps in their median price: Northeast 3.0%, Midwest 7.8%, South 5.8%, West 7.3%.
December’s 5.8% year-over-year increase in the overall median price of an existing home delivered the 70th consecutive month of year-over-year increases. The median price of $246,800 is slightly down from November’s $248,000. The last record median price was set in August at $253,500.
Single-family sales declined 2.6% on a monthly basis and increased on a yearly basis by 1.0%. The median price of $248,100 was up 5.8% year-over-year.
New Residential Sales – December, 2017
New single-family home sales in November essentially confirmed a tremendous resurgence in new home sales that was synchronized with a resurgence of existing home sales. Similar to existing home sales, new home sales dropped sharply from November’s high level. Reassuringly, year-over-year performance, and thus the uptrend, remained strong.
The Census Bureau revised November sales of new single-family homes downward from 733,000 to 689,000 (a third consecutive month with a significant downward revision as I expected). New home sales for December decreased 9.3% month-over-month but still jumped 14.1% year-over-year to 625,000. Even if the Census Bureau issues yet another large downward revision, these numbers confirm the bull run in new home sales continues. Year-over-year gains have regularly hit double digits since 2012; November’s 26.6% jump was the highest since February, 2015 when new home sales soared 29.8% year-over-year. For 2017, builders sold 608,000 new homes, an 8.3% year-over-year increase from 2016.
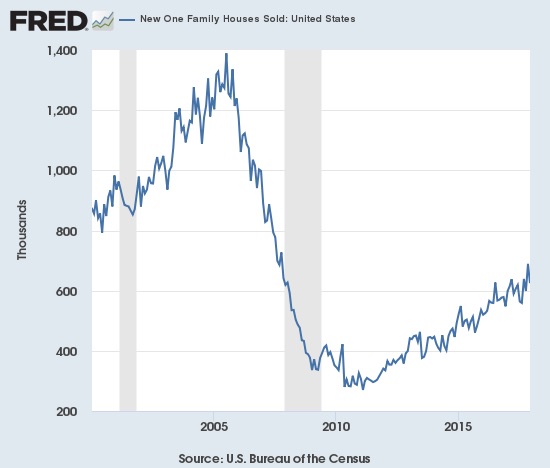
Source: US. Bureau of the Census, New One Family Houses Sold: United States [HSN1F], retrieved from FRED, Federal Reserve Bank of St. Louis, February 8, 2018.
New home sales came off a tremendous November surge. The uptrend remains intact.
In September, new home sales were strong enough to plunge inventory from 6.1 months of supply to 5.0 months. October’s inventory slipped slightly to 4.9 months of supply. The exceptionally strong sales volume of November pushed inventory to 4.6 months of supply. December’s pullback sent inventory jumping back to 5.7 months of supply. A market for homes is in balance at 6 months of supply, so the market’s recent unbalance came to an abrupt end in December.
Because new home sales jumped in October, I was surprised that the median price of a new home actually fell 3.3% from September. For November, the median fell slightly from October to November’s $318,700, a 1.2% year-over-year gain. In December, the median price jumped to $335,400, a 2.4% year-over-year gain.
On a regional basis, new home sales were much less divergent than in November. The Northeast cooled off relatively with a 10.8% year-over-year gain (compare to 65.2% for August, 54.8% for September, 64.7% for October, and 53.3% for November). The Midwest was the outlier with a 3.1% drop. The South jumped 15.2% year-over-year. With a 18.8% year-over-year gain, the West was the one region to perform closely to November’s performance (22.8%).
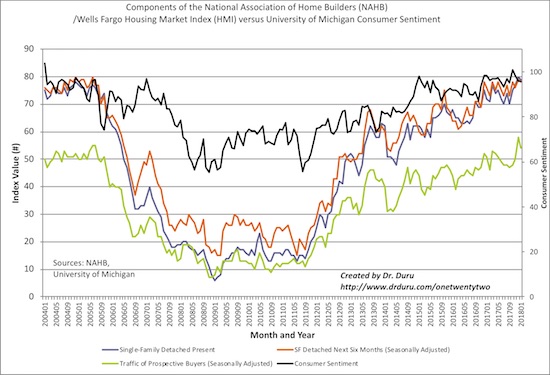
Home Builder Confidence: The Housing Market Index– January, 2018
In March, builder confidence soared to a new 12-year high at 71. For the remainder of the year, the HMI hovered just under that 12-year high. December’s reading of 74 blasted the ceiling to send HMI to a level not seen since July,1999. In January, the HMI dropped to 72, still higher than it was for most of 2017. The NAHB expressed that on-going enthusiasm for the housing market:
“Builders are confident that changes to the tax code will promote the small business sector and boost broader economic growth…Our members are excited about the year ahead, even as they continue to face building material price increases and shortages of labor and lots.”
The drop in the HMI was mostly driven by a 4 point drop in the traffic of prospective buyers to 54. The NAHB described the drop as minor, but I disagree. Since this HMI component soared from 50 to 58 in December, the disagreement is not a big deal. Since 2004, the traffic of prospective buyers spent very little time above 50. So even with January’s drop, home buyers are clearly very bullish.
Source: NAHB
The Housing Market Index (HMI) was mainly weighed down by a large drop in the traffic of prospective buyers. Still, sentiment remains very strong across the board.
In the last Housing Market Review, I concluded from the recent history of regional HMI that a large pullback in the West would drag down the overall HMI. The Midwest turned out to be the culprit as it plunged from 76 to 69. The West only dropped from 84 to 83. The South slid from 75 to 72. The Northeast soared from 53 to 62, but it was clearly not enough.
Parting thoughts
The seasonally strong period for housing stocks is no longer on a strong footing thanks to the sell-off in financial markets. Still, I am treating this pullback as the buying opportunity I thought I would not get this year.
California, particularly the San Francisco Bay Area, remains on my “close watch” list. As I noted in the last Housing Market Review, all the negatives of the housing recovery are converging there. A true housing crisis is in full swing with limited supply causing severe imbalances. For example, in Mountain View, CA, city officials rolled out a trial program to deliver sewage services to people parked on the streets in RVs (Recreational Vehicles). This move implies city officials have accepted a new reality in the growing housing crisis in the Bay Area. Whether it is limited supply and/or lack of affordability, a growing number of workers are going to extreme lengths to make ends meet.
Some people are outright giving up on the Bay Area. Redfin’s fourth quarter report on migration patterns, based on data from over a million users searching for housing on Redfin’s platform, suggested that out-migration from the Bay Area continues even as the region grows. Most interesting in this report is that Redfin claims that tax reform has surfaced as a driver for migration from expensive, high tax rate areas to more affordable locations: this observation runs counter to the reassurances from builders like Toll Brothers.
“The fourth quarter of 2017 saw people in expensive, high-tax coastal markets like San Francisco, New York, Los Angeles, search for homes in metros like Sacramento, Phoenix, Las Vegas, and Nashville where taxes are lower and housing is more affordable. This is a continuation of a trend we saw throughout the past year, but what was new last quarter was that the topic of taxes and tax reform came in conversations Redfin agents had with people looking to move away from the aforementioned coastal markets and into fast-growing mid-tier metros. We expect that in 2018, this migration pattern will intensify as tax reform becomes a reality and more people choose to relocate in search of a lower cost of living…
‘People leaving coastal hubs in search of affordability has been a consistent trend for the last five years…Late last year there was a twist. Many of the popular migration paths that we saw Redfin.com users exploring yielded tax benefits along with increased affordability. We expect these trends to continue and will be monitoring them closely in 2018.'”
Bay Area “escapees” are not abandoning the state. Their most popular destination (for searching) is Sacramento, the state capitol. For example, California cities were the top two destinations for people searching away from San Jose: 20.5% to Sacramento and 11.7% to Los Angeles. San Diego was fifth at 4.3%. The 10.1% of users who looked at Seattle will likely discover few savings housing costs. In other words, builders in California, and the West in general, are not likely to feel the effects of this net migration. Still, as Redfin notes, these patterns bear watching in 2018 and beyond.
Disclosure: long TOL calls, long LEN calls, long KBH calls, long ITB calls, long MDC shares, long MTH shares and calls, long FPH shares
Follow Dr. Duru’s commentary on financial ...
more

