
Home Improvement Centers Scramble To Help Hurricane Victims
Home Depot (HD) is the one of world's largest home improvement retailer. The company offers a level of service unprecedented among warehouse-style retailers. Home Depot stores cater to do-it-yourselfers, as well as home improvement, construction and building maintenance professionals. The Home Depot currently operates in the USA, Canada, Chile, Puerto Rico, and Argentina. The company also operates EXPO Design Centers across the U.S. and Villager's Hardware in New Jersey.
Lowe's Companies Inc. (LOW) is a retailer of home improvement products in the world, with specific emphasis on retail do-it-yourself and commercial business customers. Lowe's specializes in offering products and services for home improvement, home decor, home maintenance, home repair and remodeling and maintenance of commercial buildings. Lowe's principal customer groups are do-it-yourself retail customers and commercial business customers.
Neither of these companies are currently rated a BUY by our models. But, as we always note, our models run on fundamental financial data rather than news, rumors, etc. Over the past few weeks, stock in both companies has seen a run up in share prices by investors anticipating that the effects of both Harvey and Irma would boost the bottom line and quarterly results.
News media were awash in reports of the retailers moving hundreds of thousands of sheets of plywood, lots of generators, and other items needed by all those seeking to batten down the hatches ahead of the two massive storms.
Now, it is anticipated that home owners will be once again emptying the stores as they address damage and rebuild their homes.
Both retailers are ready, as they have greatly updated and expanded their supply chains so that they can ship new inventory and assist with the rebuilding phase. These retailers have worked with government officials to garner special transportation and other privileges that allows them to get quickly back up and running in the aftermath of disasters.
Depending on the damage, we would expect to see a definite boost for these firms in the aftermath of the storms. But, our ratings are driven by one-year forecast prices, and thus we do not see much change there until earnings and other data points are adjusted upwards to reflect the additional storm and recovery-driven sales numbers.
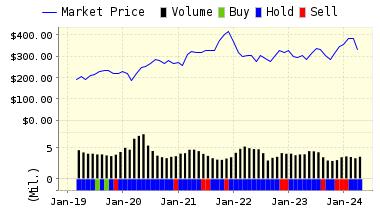
We continue our HOLD recommendation on Home Depot for 2017-09-08. Based on the information we have gathered and our resulting research, we feel that Home Depot has the probability to ROUGHLY MATCH average market performance for the next year. The company exhibits ATTRACTIVE Company Size but UNATTRACTIVE Book Market Ratio.
|
ValuEngine Forecast |
||
|
Target |
Expected |
|
|---|---|---|
|
1-Month |
159.96 | 0.19% |
|
3-Month |
159.35 | -0.20% |
|
6-Month |
161.27 | 1.01% |
|
1-Year |
163.31 | 2.29% |
|
2-Year |
160.48 | 0.51% |
|
3-Year |
156.20 | -2.17% |
|
Valuation & Rankings |
|||
|
Valuation |
2.73% overvalued |
Valuation Rank |
|
|
1-M Forecast Return |
0.19% |
1-M Forecast Return Rank |
|
|
12-M Return |
21.64% |
Momentum Rank |
|
|
Sharpe Ratio |
1.26 |
Sharpe Ratio Rank |
|
|
5-Y Avg Annual Return |
19.42% |
5-Y Avg Annual Rtn Rank |
|
|
Volatility |
15.42% |
Volatility Rank |
|
|
Expected EPS Growth |
11.48% |
EPS Growth Rank |
|
|
Market Cap (billions) |
210.40 |
Size Rank |
|
|
Trailing P/E Ratio |
22.72 |
Trailing P/E Rank |
|
|
Forward P/E Ratio |
20.38 |
Forward P/E Ratio Rank |
|
|
PEG Ratio |
1.98 |
PEG Ratio Rank |
|
|
Price/Sales |
2.16 |
Price/Sales Rank |
|
|
Market/Book |
159.52 |
Market/Book Rank |
|
|
Beta |
1.05 |
Beta Rank |
|
|
Alpha |
-0.03 |
Alpha Rank |
|
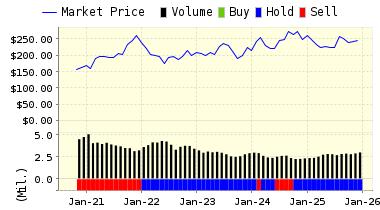
We continue our HOLD recommendation on Lowe's Companies Inc. for 2017-09-08. Based on the information we have gathered and our resulting research, we feel that Lowe's Companies Inc. has the probability to ROUGHLY MATCH average market performance for the next year. The company exhibits ATTRACTIVE Company Size but UNATTRACTIVE Book Market Ratio.
|
ValuEngine Forecast |
||
|
Target |
Expected |
|
|---|---|---|
|
1-Month |
78.67 | 0.14% |
|
3-Month |
78.51 | -0.06% |
|
6-Month |
78.10 | -0.59% |
|
1-Year |
79.87 | 1.67% |
|
2-Year |
79.07 | 0.66% |
|
3-Year |
80.30 | 2.22% |
|
Valuation & Rankings |
|||
|
Valuation |
4.06% undervalued |
Valuation Rank |
|
|
1-M Forecast Return |
0.14% |
1-M Forecast Return Rank |
|
|
12-M Return |
5.98% |
Momentum Rank |
|
|
Sharpe Ratio |
1.02 |
Sharpe Ratio Rank |
|
|
5-Y Avg Annual Return |
19.07% |
5-Y Avg Annual Rtn Rank |
|
|
Volatility |
18.65% |
Volatility Rank |
|
|
Expected EPS Growth |
10.94% |
EPS Growth Rank |
|
|
Market Cap (billions) |
76.43 |
Size Rank |
|
|
Trailing P/E Ratio |
17.91 |
Trailing P/E Rank |
|
|
Forward P/E Ratio |
16.14 |
Forward P/E Ratio Rank |
|
|
PEG Ratio |
1.64 |
PEG Ratio Rank |
|
|
Price/Sales |
1.13 |
Price/Sales Rank |
|
|
Market/Book |
17.85 |
Market/Book Rank |
|
|
Beta |
1.05 |
Beta Rank |
|
|
Alpha |
-0.17 |
Alpha Rank |
|
Disclosure: None.


