
Goldilocks, R. I. P. (Part 3)
<< Read More: Goldilocks, R. I. P. (Part 2)
<< Read More: Goldilocks, R.I.P. (Part 1)
The first law of Bubble Finance is that stock market crashes trigger recessions, not vice versa. That stands your grandfather's macroeconomics on its ahead, yet the casual chain from which it arises is straight forward.
To wit, in a world of Peak Debt ($230 trillion globally), central bank money pumping mainly inflates financial bubbles. Such bubbles eventually reach blow-off extremes and then burst, thereby sending stock (option) obsessed corporate C-suites into paroxysms of restructuring and downsizing designed to appease the trading gods of Wall Street.
The main street sacrificial lambs thus tossed overboard----workers, inventories, plants, stores, warehouses, other "redundant" fixed assets and CapEx outlays---are what we are pleased to call recessions nowadays.
Needless to say, you can't see these bouts of C-suite mayhem coming if your dashboard is still cluttered with your grandfather's macro-monitors. That is, the junk data from the BLS and Commerce Department.
By the same token, you will most surely espy Goldilocks prancing through these incoming data reports because at this late stage of the business cycle they are really nothing more than a read-out on capitalism's inherent impulse to trudge forward until it is monkey-hammered by the central bank and its imploding bubbles.
That is to say, the next recession is embedded in the stock charts because they are the Bubble tracker in plain sight. And here is the leading indicator at the present moment----the utterly lunatic trading metrics for Amazon (AMZN).
As the current bubble metastized after the immediate post-recession rebound in the stock market, the momo crowd piled into AMZN because the "price action" was just plain awesome. Between the March 2009 bottom and January 2017, the stock soared from $65 to $750 per share or by nearly 1100%. And it did so without any regard for AMZN's profitless prosperity---perhaps signified by its 170X PE multiple at the end of 2016.
The again, when it comes to miracle stocks and the Great Disrupters, profits are--apparently--a matter of will, not performance. If Jeff Bezos wanted profits, the true believers insist, he would will them. Simple.
Still, since the beginning of 2017, even the willpower meme has begun to get way in front of its skis. During the past 14 months, Amazon's market cap exploded by $400 billion----rising from $360 billion in January 2017 to $760 billion at present. At the same time, its LTM operating free cash flow plunged from a meager $9.5 billion ( on $136 billion of sales) to just $6.5 billion during the year ending in December.
Since the rules of arithmetic apparently have not yet been "disrupted", AMZN's implied multiple on operating free cash flow has erupted from an already frisky 39X to a completely absurd 120X.
Needless to say, no 24-year old company with virtually no cumulative profits and free cash flow to show for itself should trade at anything remotely close to a triple digit multiple----and that's to say nothing of one that's essentially in the books, schmatta, gadgets and food sourcing, moving, storage and moving business.
AMAZON 14-MONTH CHANGE
(Click on image to enlarge)

Oh, yes, AMZN is allegedly a tech company owing to its cloud business (AWS). But that's exactly the skunk in the woodpile.
When you set aside AWS' sales and operating income during 2017, Amazon's e-Commerce business generated $160 billion of sales, but posted operating income of negative $200 million.
That's right. The monster of the retail midway posted no profit whatsoever last year!
And it's getting worse. During 2016 the e-Commerce business posted $1.1 billion of operating income on $124 billion of sales; and the year before that (2015) operating income was $2.6 billionon e-Commerce sales of $99 billion.
Stated differently, incremental annual sales of $61 billion over the past three years resulted in a $2.8 billion reduction in operating profit.
It should be enough to say, you can't make this stuff up and be done with it. But the nattering nincompoops who keep showing up on bubblevision with a "buy" recommendation always have another rationalization for the sheer insanity of it.
For instance, awhile back Jeff Bezos proclaimed that “When we win a Golden Globe, it helps us sell more shoes."
At a loss, we would add.
Still, an Amazon bull showed up on bubblevision yesterday all breathless about a study that showed the following:
.... the first season of the popular drama “The Man in the High Castle,” an alternate history depicting Germany as the victor of World War Two, had 8 million US. viewers as of early 2017, according to the documents. The program cost $72 million in production and marketing and attracted 1.15 million new subscribers worldwide based on Amazon’s accounting, the documents showed.
Amazon calculated that the show drew new Prime members at an average cost of $63 per subscriber. That is far less than the $99 that subscribers pay in the United States for an annual Prime membership...
You don't say, would be one possible rejoinder.
Another would be: Doesn't that same $99 membership offer unlimited free shipping, unlimited viewing of thousands of other Prime video content items for which AMZN is now spending $5 billion per year and numerous other freebies?
For example, approximately how many Pampers orders would it take for the free shipping of mostly packaged air to eat up the $36 balance?
And that's assuming there is no viewer churn after a season or two of the Obergruppenfuhrer's demented antics.
Even the undoubted prowess and growth capacity of its AWS cloud service doesn't come close to squaring the circle. In the year just ended, for example, its net income was about $3.4 billion at AMZN's 20% tax rate.
The problem with valuation, of course, is that stripped of all its techno gee wiz, AWS is just a giant, capital intensive server farm-----for which AMZN provides no segment data on assets, CapEx or free cash flow.
We would bet, therefore, that the good part of AWS is the 45% growth rate of sales and its 25% operating margins, not its massing up of balance sheet bulk or return on invested capital. For instance, Amazon's finances its server farms heavily with capital leases, which on a total company basis have soared from $2 billion to $13 billion during the last four years, and no small chunk of that undoubtedly went to AWS.
Needless to say, the cloud business' current super-hot growth rates mainly represents a one-time share capture from traditional standalone computer capacities. Accordingly, there is no reason to assign a crazy valuation multiple to a highly competitive business based on heavy-duty capital asset throw-weight, which will eventually bend to the single digit growth arc of the GDP.
So give it a 50X PE multiple and be done with it. That implies AWS is worth $160 billion, and the e-Commerce business is worth $500 billion.
Like we said, a market which is valuing a zero profit business that churns $160 billion per year of GDP anchored goods tells you all you need to know. That is, the true recession indicator of the Bubble Finance world is reaching it blow-off top.
Nor is AMZN any kind of one-off outlier. How could it be when it alone has a three-quarter trillion market cap, and is host to the biggest round-up of momentum chasing punters and robo-machines in recorded history?
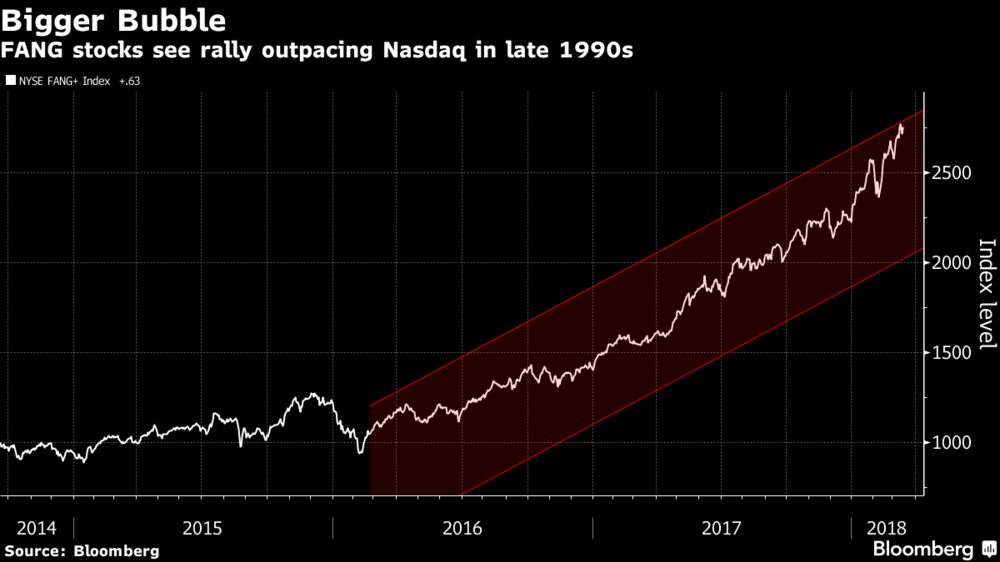
But as even Bloomberg pointed out recently, the FAANG+ stocks are now outdoing even the NASDAQ 100 blow-off of late 1999/early 2000.
The rally in the FANG block of tech shares and its megacap brethren just surpassed a dubious milestone.
An index of 10 tech growth shares pushed its advance to 23 percent so far this year, giving the group an annualized return since early 2016 of 67 percent. That frenzied pace tops the Nasdaq Composite Index’s 66 percent return in the final two years of the dot-com bubble.
So crazed has the "tech" sector been since the turn of the year that it's even got the go to numbers factory of the perma-bull camp, Bespoke Investment Group, wondering out loud:
Lately, it seems, these stocks can do no wrong,” George Pearkes, a macro strategist at Bespoke Investment Group, wrote in a note. It makes “us wonder if this is a mini-1999 all over again,” he said.
Ya think?
(Click on image to enlarge)
Well it mightfell like early 2000 all over again. The 10-stocks in the Bloomberg index---- Facebook, Amazon, Netflix, Google,Apple, Twitter, Alibaba, Baidu, Nvidia and Tesla----currently weigh in with a combined market cap of $3.5 trillion compared to only $1.4 trillion in January 2016.
But here the thing. Two years ago this group of 10 high flyers had posted $350 billion of net income for the LTM period ending in December 2015, and were thus valued at 34X.
In the interim, their collective income has risen by 22% to $430 billion, meaning the PE multiple now stands at 75X.
And there you have it----massive, nearly parabolic PE expansion in what will soon be the longest business cycle expansion in recorded history. That's the real flashing red indicator that tells you the third bubble crash of this century is nigh, and the recession to follow is already baked into the cake.
Needless to say, there is nothing terribly profound about the observation that when valuation multiples go parabolic, the end is near. Even the usual Bloomberg market cheerleaders were forced to admit that some pretty heavy duty investors have come to the same conclusion:
It’s not the first time that Wall Street voiced warnings on FANG stocks. In November 2016, Jeff Gundlach, chief investment officer at DoubleLine Capital LP, urged investors to avoid the group. Eight months later, Howard Marks, the co-chairman of Oaktree Capital Group LLC, listed addiction to FAANG-fomented gains among a handful of investor vulnerabilities that could spell doom for the bull market.
That hasn’t stopped investors from flocking to these high flyers. In fact, their gains have been accelerating. The NYSE FANG index has risen 76 percent in the past year, picking up pace from 41 percent in the previous 12 months.
And their valuations are rivaling those that tech stocks fetched during the heyday of the dot-com era. At 64 times earnings, the companies in the NYSE FANG+ Index are valued at a multiple that’s almost three times the broader gauge’s. That compared with 27 times in March 2000.
You can call it Silicon mountain, and already this year the inflow to tech funds and ETFs annualizes to $47.5 billion and is way off the charts. Indeed, its very much like the ones in northern Scotland where the lemmings make their periodic stampede off the cliffs to the dark, cold churning seas below.

Then again, it's not just the tech high flyers, either. In the case of the S&P 500 ex-financials, the net debt to EBITDA multiple now stands at a 50 year high for the median company.


