
GE Helped Lower By The Market Correction
For stocks already in a downward trend, the events of the last few weeks merely servers to reinforce what is already in place, and further accelerate the bearish sentiment, which is certainly the case for another blue chip stock and one which I included in my most recent book Stock Trading & Investing Using Volume Price Analysis. In the book, which was written towards the end of 2017, I wrote the following:
‘and with no sign yet of any buying by the market makers GE looks set to fall further to the end of 2017 and into 2018’
The stock at that time was trading at $20.13.
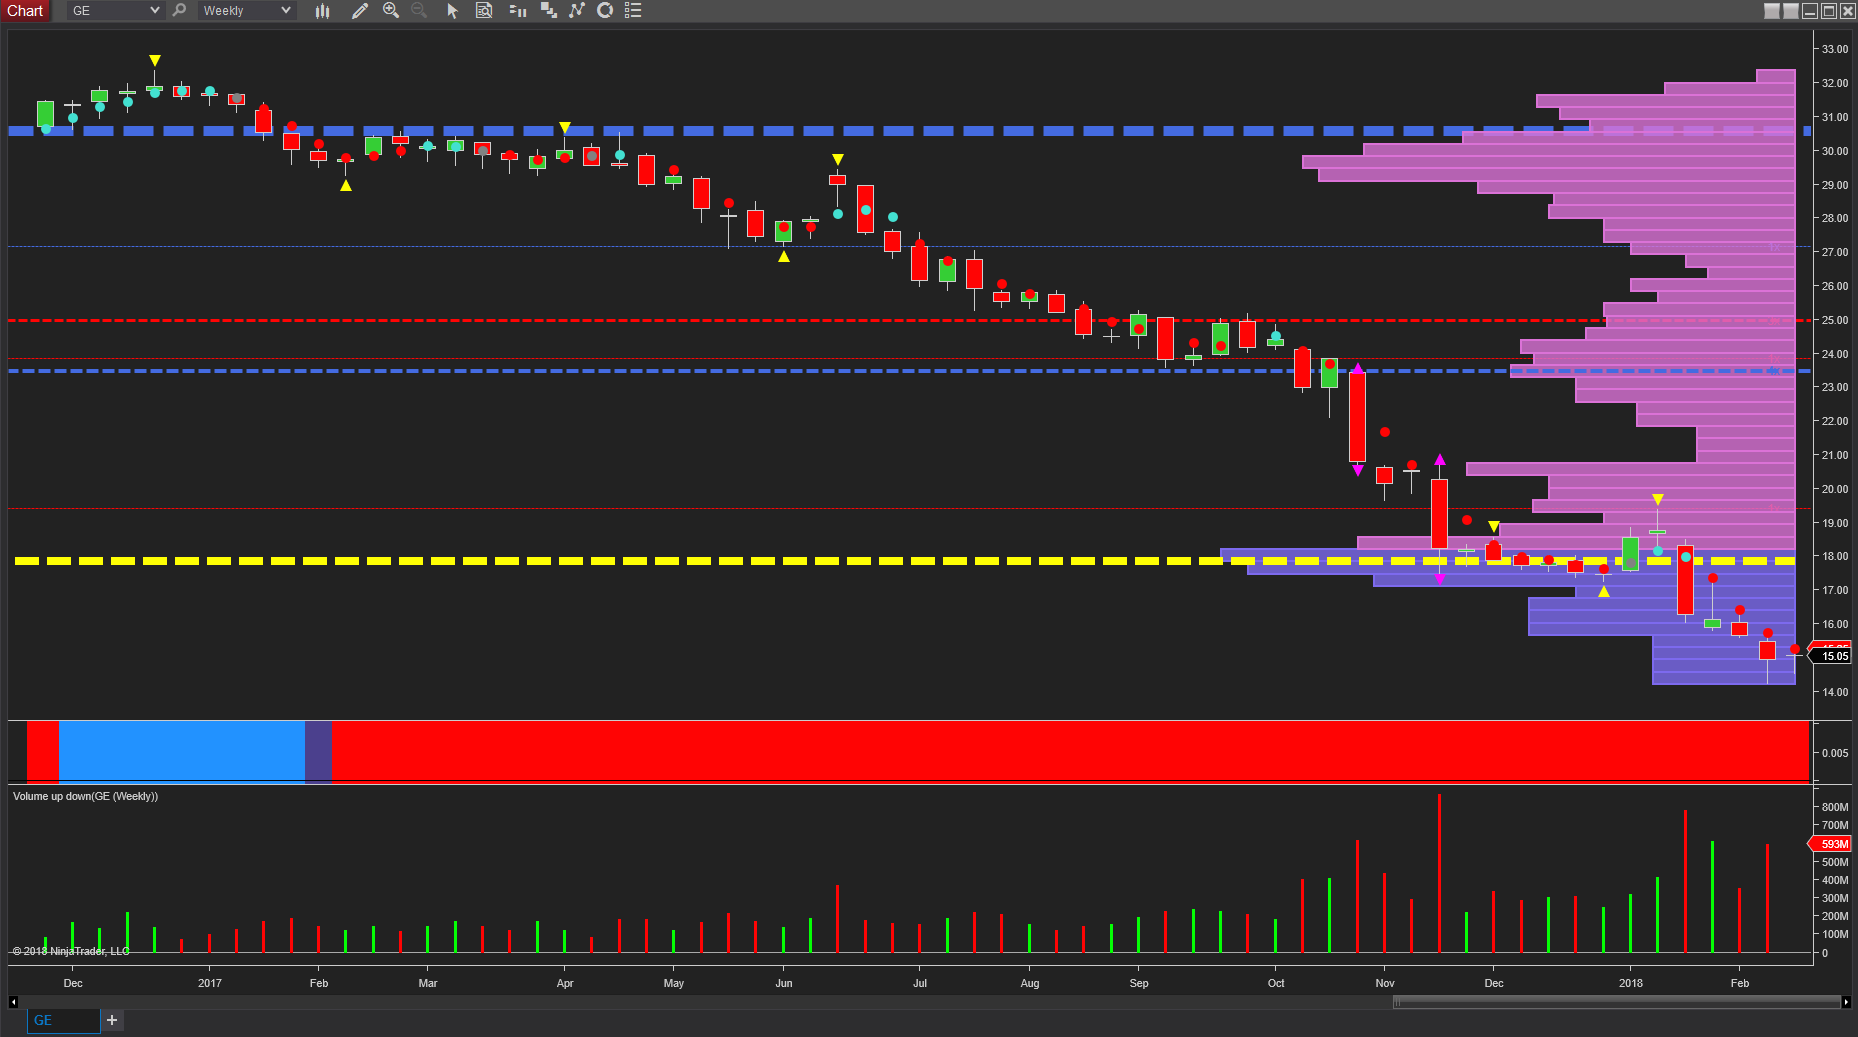
As we can see from the weekly chart, the attempt to rally in early 2018 was snuffed out as heavy selling in the wide spread down candle of mid January injected further bearish momentum into this stock. The following week was characterised with short covering under high volume with the deep wick to the upper body confirming the very weak picture and confirmed over the next two weeks as the primary indices sold off sharply in the recent correction.
The question now is how low can GE go? And it is interesting to note we have seen the first signs accumulation in the $15 region with the wick to the lower body of the candle and high volume of two weeks ago. This may be an early signal market makers are starting to accumulate this stock, but given the extent of the bearish trend, any reversal higher is likely to take weeks or even months to develop, and the present bounce more likely to be followed by an extended congestion phase in this region.
Disclaimer: Futures, stocks, and spot currency trading have large potential rewards, but also large potential risk. You must be aware of the risks and be willing to accept them in order to invest in ...
more

