
Flushing Cash Into The Casino—The Media Stock Swoon Shows That It Works Until It Doesn’t
If you don’t think the Fed and other central banks have transformed financial markets into debt besotted gambling casinos, consider the last few days of carnage in the media stocks. That sector is rife with bubble finance infections.
To wit, hedge fund speculators feasting on zero interest carry trades and cheap options own 10% of the 15 companies which comprise the S&P Media index. That happens to be the highest hedge fund ownership ratio among all 23 S&P industry sectors.
So given that the essential modus operandi of hedgies is leveraged gambling, not hedging risk, it is not surprising that they have ganged-up on the media stocks. Indeed, as Zero Hedge noted with respect to this week’s sharp and unexpected sell-off:
The love affair between hedge funds and media stocks is being tested. As Bloomberg reports, hedge funds have been near-constant champions of the industry, drawn in by its high cash generation and buybacks, takeover speculation and the straight-up momentum of the stocks themselves. This week’s retreat represents the sharpest rebuke to that thesis — and one of its only setbacks in a bull market well into its seventh year.
Indeed, it has been a perfect fit. These companies—–such as Disney, Time Warner Inc., Fox, CBS and Comcast——are notorious financial engineers, using massive amounts of the dirt cheap debt enabled by the Fed to fund incessant M&A takeovers and prodigious stock buybacks. That’s exactly the kind of financial milieu in which hedge funds thrive; and one, by the same token, that would not even exist in an honest free market.
Not surprisingly, therefore, the S&P media index went parabolic in response to the Fed’s post-crisis money printing spree. From an aggregate market cap of about $135 billion at the March 2009 bottom, the index had soared by 520% to nearly $700 billion before this week’s $50 billion or 8% loss. Needless to say, it wasn’t the geniuses who inhabit Mickey’s house or the machinations of Rupert Murdoch that made all the difference.

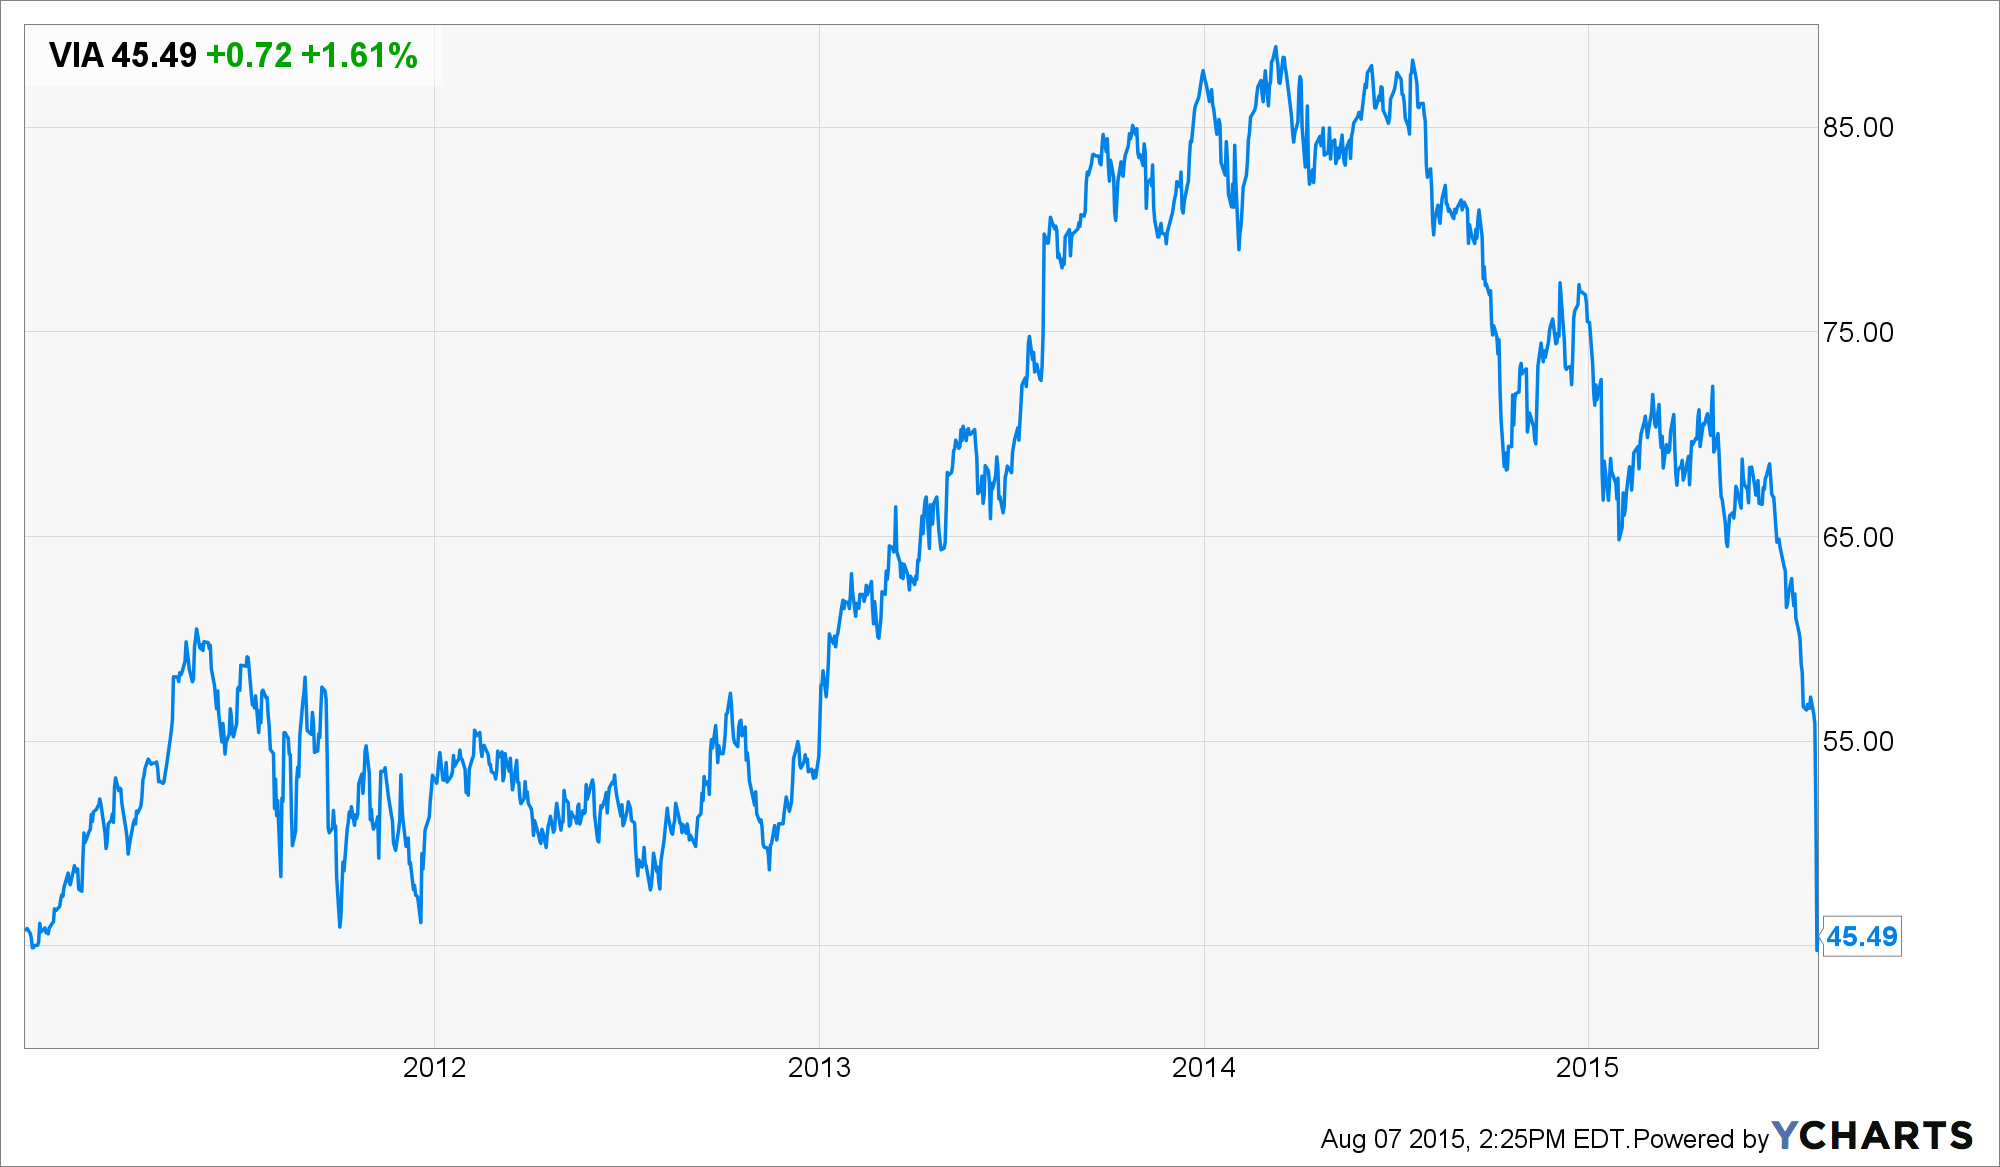
No, the S&P media index was propelled upward during the last six years by an endless flood of fresh cash into the Wall Street casino that kept hedge funds and robo-traders upping their bets on the next M&A deal or stock buyback announcement. Viacom (VIA) is a poster boy for the latter.
As shown below, this week’s body slam—triggered by the belated realization that the cable companies’ long suffering customers are now “cutting the chord”—— has taken VIA’s share price all the way back to its late 2010 levels.
But since customer defection has been a long-standing risk and wasn’t exactly new news, the question recurs. Exactly what was it that caused Viacom’s stock price to double in the interim and thereby shower upwards of $20 billion in market cap gains on the hedge fund gamblers who chased it?
The cause for the rip pictured below would most definitely not be growth of earnings or free cash flow. In the fiscal year ending in September 2011, Viacom posted $8.7 billion of EBITDA and that turned out to be the high water mark. Even as its stock price was soaring in the next two years, its EBITDA slithered downward to $8.2 billion in its most recent (June) LTM report.
Likewise, net income of $2.12 billion in 2011 has now slide to $1.77 billion on an LTM basis.
In fact, Viacom levitated its stock the new fashioned way. During the last 19 quarters it has plowed $17.6 billion back into the casino in the form of stock buybacks ($15.1 billion) and dividends ($2.5 billion). But before you praise VIA for its seemingly shareholder friendly ways, consider this: During the same period it only earned $10.2 billion of net income.
That’s right. It distributed 175% of its net income!
Under the rules of old-fashioned finance that kind of reckless self-liquidation would have been considered a flashing red warning signal to hit the sell button. That would have been especially appropriate in this case since Viacom’s business model has always depended upon the improbable capacity of its cable distributors to extract punitive monopoly prices from their residential customers indefinitely.
Yet when the fundamentals reared their ugly head in this quarter’s round of media company earnings releases, the gamblers professed to be downright shocked, Why the resulting sell-off, which lopped $8 billion off VIA’s market cap in a flash, was purportedly not on the level, at all:
People are shooting first and asking questions later…this indiscriminate selling, to me, is just nuts,” exclaims on billion-dollar AUM hedge fund CIO as media stocks faced a bloodbath this week.
Well, this week’s action wasn’t exactly shooting first; it was more like asking questions way too late. In fact, the entire $20 billion market cap bubble that the most nimble-footed hedge funds feasted upon was just the result of a leverage trick. Nearly the entire $7 billion gap between what Viacom earned and what it distributed to shareholders over the last 29 quarters was borrowed!

But here’s the thing. Viacom’s fundamentals are visibly deteriorating. Its $3.05 billion of revenue in Q2 2015 was down 10.6% from prior year and 17% from the June quarter two years ago.
Stated differently, Viacom’s peak price of $90 per share, which equated to about $40 billion of market cap one year ago, had nothing to do with “price discovery” in the equity capital markets. It was a pure case of debt-fueled speculation in the casino.
But VIA is a piker compared to most companies in the media index. Take Time Warner (TWX). Looking at the stock chart from March 2009 forward you would think that the company was a found of earnings growth and value creation. Alas, you would be wrong.
Time Warner’s pre-tax income was $4.5 billion in its most recent 12 month period—–compared to $4.4 billion way back in 2011. While 2% growth in three and one-half years is not much to write home about, the casino gamblers were not slowed in the slighted. Perhaps they were impressed with the 25% growth in its net income line, but if so they were capitalizing a one-time reduction in its tax rate—-from 34% to 19.4% over the period—-as if it represented permanent growth of earnings.
In either case, gamblers have been in a rambunctious mood. The companies stock price had rebounded by 6X from the March 2009 low. And even with this week’s sell-off, the TWX stock price had risen at a 35% compound rate during the last three years at a time when its actual pre-tax income was up by 2%.

Needless to say, there is no mystery as to how this disconnect occurred. The company simply pumped cash into the casino like there was no tomorrow. To wit, during the last six and one-half years, TWX distributed $29 billion in dividends and stock repurchases to shareholders compared to net income of just $20 billion.
So it was the same formula as Viacom’s. Distribute every dime of earnings, and then top it up with a big heap of money that could be borrowed on the cheap.
In TWX’s case, its net debt grew from $11.5 billion in 2009 to $20.7 billion in the quarter just ended. That is, it borrowed every single dime of its $9 billion of distributions over and above its earnings during the period.
The bottom line is pretty straight-forward. Just prior to this week’s correction TWX was valued at $90 billion versus operating free cash flow of $2.8 billion in the LTM period just posted. It could be said that 26X free cash flow is a pretty sporty valuation for a no-growth company.
But then you should try CBS. It too has been a stock market rocket, and it too flushed $11 billion into the casino in the last four and one-half years in the form of stock buybacks and dividends. That was 140% of it net income during the period.
Likewise, another member of the S&P Media index, Comcast, distributed $28 billion in stock repurchases and dividends during the last four and one half-years or just slightly less than its cumulative net income of $31 billion over the period. Needless to say, it made ends meet after hefty investments by borrowing; its net debt soared from $25 billion in 2010 to $45 trillion in the most recently ended quarter.
Even the mighty Disney had little use for its $31 billion of net income during the same four and one-half year period ending the recent June quarter. It flushed fully $27 billion or 88% of it net income back into the casino.
During the most recent quarter debt issuance by US companies reached an all-time high, raising a question as to why companies still need to borrow so much after selling $7 trillion of U.S. debt securities since 2008.
This weeks S&P Media index swoon leaves no doubt as to the answer. Companies have not been borrowing to grow; they have been borrowing in order to flush cash into the casino.
Charles Ponzi once had a scheme that was not essentially different. Yes, and it worked until it didn’t.
Disclosure: None.


