
Featured Stocks In April’s Safest Dividend Yields Model Portfolio
Six new stocks make our Safest Dividend Yield Model Portfolio this month, which was made available to members on April 20, 2018.
Recap from March’s Picks
Our Safest Dividend Yield Model Portfolio outperformed the S&P 500 last month. The Model Portfolio rose 0.1% on a price return basis and rose 1.1% on a total return basis. The S&P 500 was unchanged on a price return and total return basis. The best-performing stocks in the portfolio were large-cap stock Patterson Companies (PDCO), which was up 5%, and small-cap stock, Liberty Tax (TAX), which was up 7%. Overall, 11 out of the 20 Safest Dividend Yield stocks outperformed the S&P in March.
This Model Portfolio leverages our Robo-Analyst technology[1], which scales our forensic accounting expertise (featured in Barron’s) across thousands of stocks.[2]
This Model Portfolio only includes stocks that earn an Attractive or Very Attractive rating, have positive free cash flow and economic earnings, and offer a dividend yield greater than 3%. Companies with strong free cash flow provide higher quality and safer dividend yields because we know they have the cash to support the dividend. We think this portfolio provides a uniquely well-screened group of stocks that can help clients outperform.
Featured Stock for April: Kimberly-Clark Corp (KMB: $100/share)
Kimberly-Clark Corp (KMB), a global manufacturer of personal care products, is the featured stock in April’s Safest Dividend Yields Model Portfolio. We previously featured KMB as a Long Idea in November 2017. Since then, the stock has underperformed the S&P 500 (-14% vs. S&P +4%) despite improvement in its fundamentals. The price decline makes shares look even more undervalued.
Over the past five years, KMB has grown after-tax profit (NOPAT) by 2% compounded annually even as revenue declined by 3% compounded annually. NOPAT margins increased from 11% in 2012 to 14% in 2017 while the company’s return on invested capital (ROIC) improved from 12% in 2012 to 15% in 2017. Long-term, KMB has grown NOPAT by 4% compounded annually since 1998.
Figure 1: KMB’s NOPAT Growth Since 1998
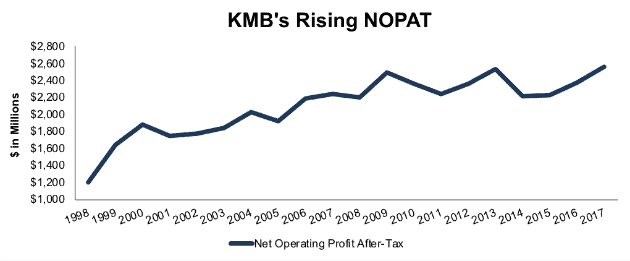
Sources: New Constructs, LLC and company filings
Free Cash Flow Supports Dividend Payments
In our Long Idea report, we noted that KMB has grown its dividend payment for over four decades. Better yet, this consistent dividend payment, and growth, has been supported by the firm’s strong free cash flow. Since 2013, KMB’s annual dividend has increased from $3.24/share to $3.88/share in 2017, or 5% compounded annually. Over this time, KMB has generated a cumulative $14.7 billion (42% of market cap) in FCF while paying $6.2 billion in dividends.
Companies with strong free cash flow provide higher quality dividend yields because we know the firm has the cash to support its dividend. On the flip side, dividends from companies with low or negative free cash flow cannot be trusted as much because the company may not be able to sustain paying dividends.
Figure 2: KMB’s FCF vs. Dividends Since 2013
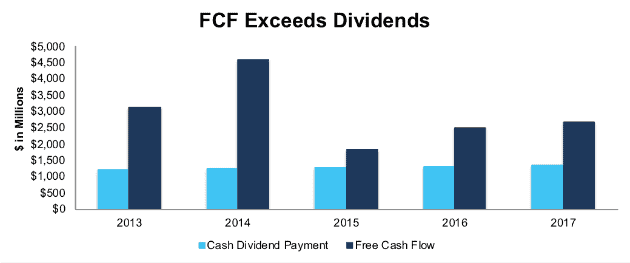
Sources: New Constructs, LLC and company filings
KMB Remains Undervalued
At its current price of $100/share, KMB has a price-to-economic book value (PEBV) ratio of 0.8. This ratio means the market expects KMB’s NOPAT to permanently decline by 20%. This expectation seems pessimistic given KMB’s ability to grow NOPAT by 4% compounded annually over the past two decades.
If KMB can maintain 2017 NOPAT margins (14%) and grow NOPAT by just 3% compounded annually over the next decade, the stock is worth $155/share today – a 55% upside.
Critical Details Found in Financial Filings By Our Robo-Analyst Technology
As investors focus more on fundamental research, research automation technology is needed to analyze all the critical financial details in financial filings. Below are specifics on the adjustments we make based on Robo-Analyst findings in Kimberly-Clark’s 2017 10-K:
Income Statement: we made $1 billion of adjustments with a net effect of removing $274 million in non-operating expense (2% of revenue). We removed $653 million related to non-operating expensesand $378 million related to non-operating income. See all adjustments made to KMB’s income statement here.
Balance Sheet: we made $7.4 billion of adjustments to calculate invested capital with a net increase of $7.4 billion. There were no adjustments that decreased invested capital. The most notable adjustment was $2.9 billion (31% of reported net assets) related to other comprehensive income. See all adjustments to KMB’s balance sheet here.
Valuation: we made $10.4 billion of adjustments with a net effect of decreasing shareholder value by $10.4 billion. There were no adjustments that increased shareholder value. Apart from $8.5 billion in total debt, which includes $525 million in operating leases, the largest adjustment to shareholder value was $1.2 billion in underfunded pensions. This adjustment represents 3% of KMB’s market value. Despite the decrease in shareholder value, KMB remain undervalued.
Disclosure: David Trainer, Kyle Guske II and Sam McBride receive no compensation to write about any specific stock, style, or theme.


