
Enough Pessimism Already, DJIA 30,000 Probable By Year End
Summary
- DJIA price started October at an all-time high of 26,818 and promptly retreated 9%, despite a plethora of good news. On October 31, 2018 the DJIA closed at 25,116.
- The U.S. economy remains strong. DJIA earnings and dividends are rising and should continue into Q4 and beyond.
- The Fed value of the DJIA is above 43,000 compared to its price of 25,116
- The dividend discount value of the DJIA is expected to rise above 50,000 as dividends begin to follow earnings
- The concerns about the mid-term elections will soon be behind us, so use the present weakness in the DJIA to buy and enjoy the ride through 30,000 as soon as the end of this year.
The term “Dismal Science” was coined by my fellow Scot, Thomas Carlyle, to describe the discipline of economics. The term was inspired by T. R. Malthus' gloomy prediction that population would always grow faster than food, dooming mankind to unending poverty and hardship. A similar gloomy outlook was proffered about the streets of London being swamped by horse manure. Both predictions resulted from man’s amazing propensity for projecting the most recent trend ad-infinitum.The same holds true of the stock market but the fundamentals tell a more enlightened story.
Helter-skelter October saw rising interest rates that triggered Algo traders, who were followed by momentum players, who in turn were followed by portfolio managers trying to lock in year-end profits in the FANGs, followed by margin calls and concern ahead of the mid-term elections. How much worse could things get?
October’s 9% correction of the DJIA has given rise to a plethora of gloomy predictions about both the economy and the stock market. Since the Lehman crisis forecasts of the economy and the DJIA have been less than stellar with a pending disaster being seen around every corner. Finally, the Cassandras are feeling vindicated by October’s misguided correction and are delighted that “the end of the world is nigh”.
The only thing that has negatively changed from my previous forecast is the yield of the 30 year T bond has breached the upper level of my projected range of 2.75% to 3.25% driven by a rising Funds rate. However, not by much and its impact has been more than offset by a substantial increases earnings and the expectation of a substantial jump in the aggregate DJIA dividend as we move into the first half of 2019.
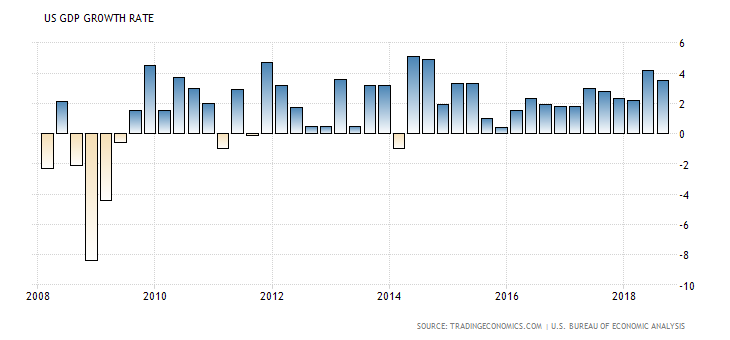
While the rate of increase in U.S. GDP slowed from 4.2% in Q2 to 3.5% in Q3 it could hardly be claimed that this is as a recession.
Inflation is lower than expected and with the US dollar strengthening it could well remain in check for some time. The strength of the dollar is generally attributed to rising U.S. interest rates. However, with the yield curve remaining relatively flat it is necessary to take a step back and look at the changes in the monetary base find a more compelling explanation for both the strength in the U.S dollar and the flat yield curve.
“This Time Things are different”
Following the financial meltdown of 2008, the U.S. monetary base expanded at an incredible pace. In 2008 the entire monetary base stood at $0.84 trillion in August 2008 to $4.075 trillion in August 2014. An almost 5 fold increase in 6 years.
Before Lehman, all increases in the monetary base flowed through the banking system into the real economy. After Lehman, the bulk of the increase remained at the Fed in the form of excess bank reserves which, for the first time, earned interest.
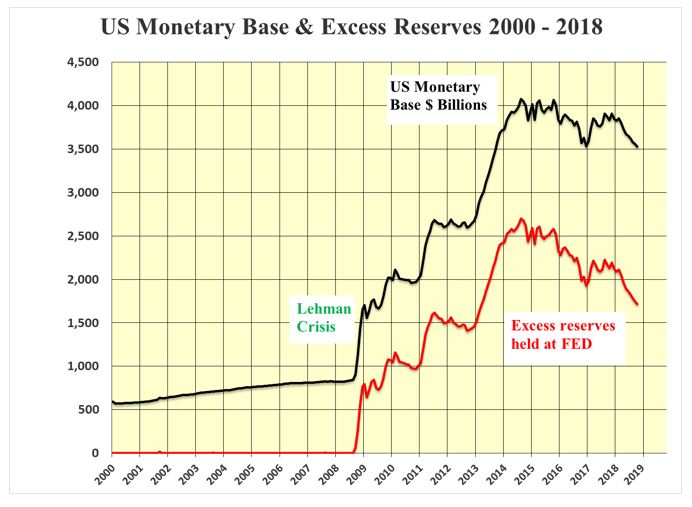
The excess reserves continued to rise to its peak of $2.7 trillion in August 2014 when the Fed ended quantitative easing. The excess reserves have fallen more quickly than the total reserves as the commercial banks pushed money out into the real economy while the Fed reduced its balance sheet.
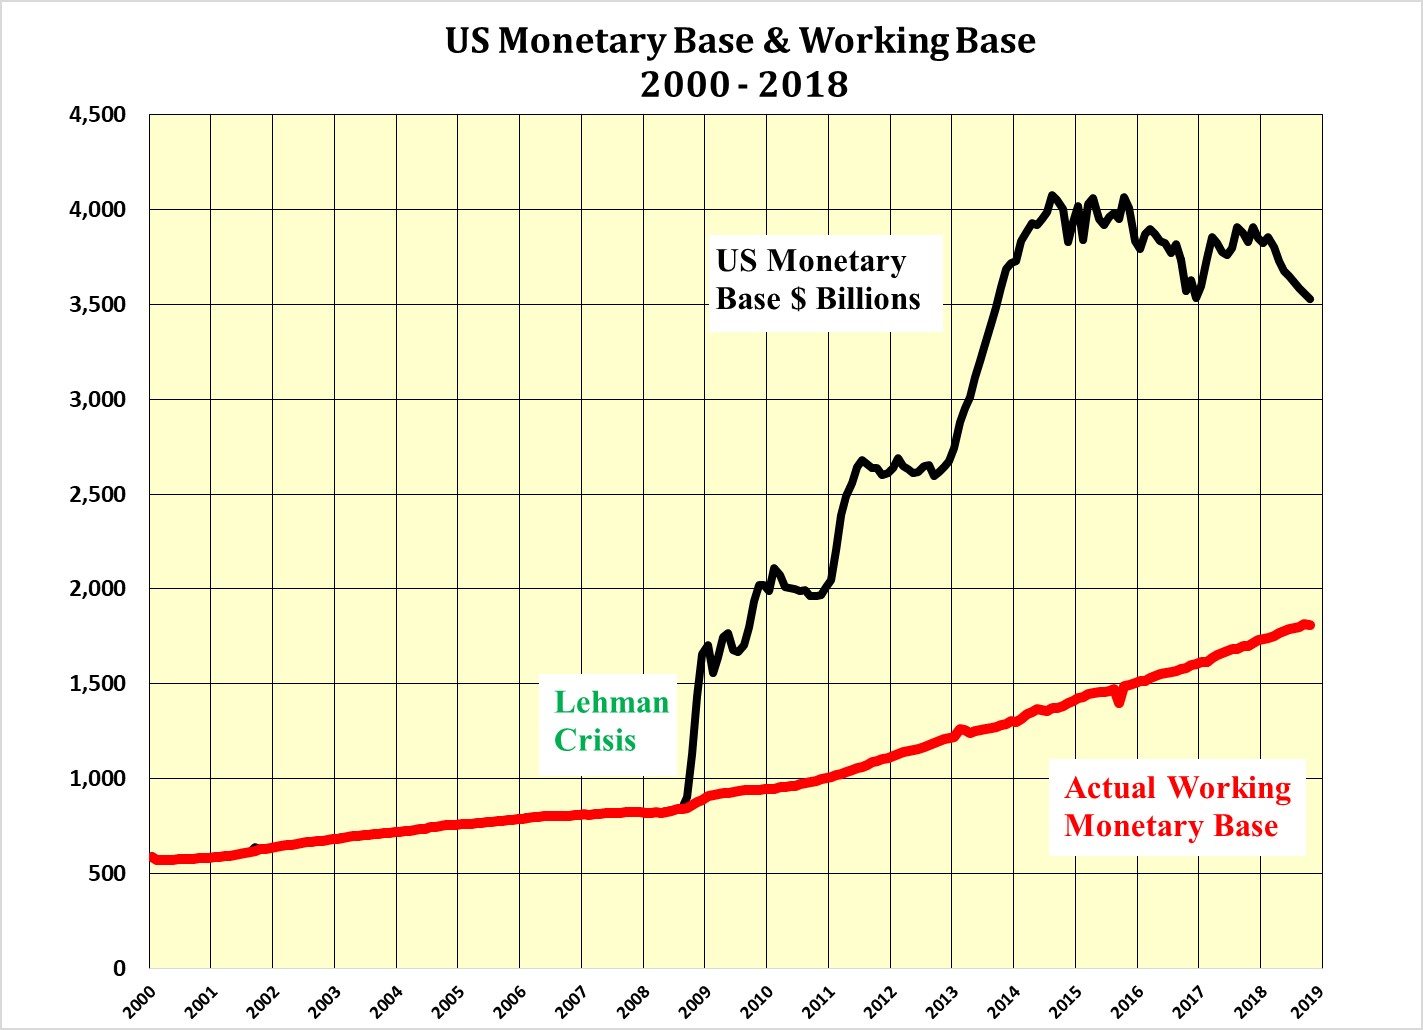
Subtracting the excess reserves from the total monetary base shows the Actual Working Monetary Base, AWMB, that has made it through to the real economy. This is shown in red in the following chart. The AWMB is still rising despite quantitative contraction by the Fed.
Furthermore, with excess reserves standing at $1.7 trillion, ample funds are available for the AWMB, and hence the U.S. economy, to continue to expand for years to come even though the overall monetary base is contracting. This is decidedly different from pre-Lehman conditions and different outcomes should be expected.
For example, the Fed can control the AWMB by adjusting the interest paid on excess reserves. IOER. A higher rate would slow the outflow of excess reserves while a lower rate should accelerate the rise of the AWMB. This gives the Fed an additional tool to control the economy which it did not have before Lehman.
Considering currencies as commodities, if the supply of one is contracting relative to another one would expect the price of the first to rise relative to the other and vice-versa. As the total U.S. monetary base is contracting while those of the Euro, Yen, Yuan and Pound are expanding then the price of the U.S. dollar should rise relative to the others.
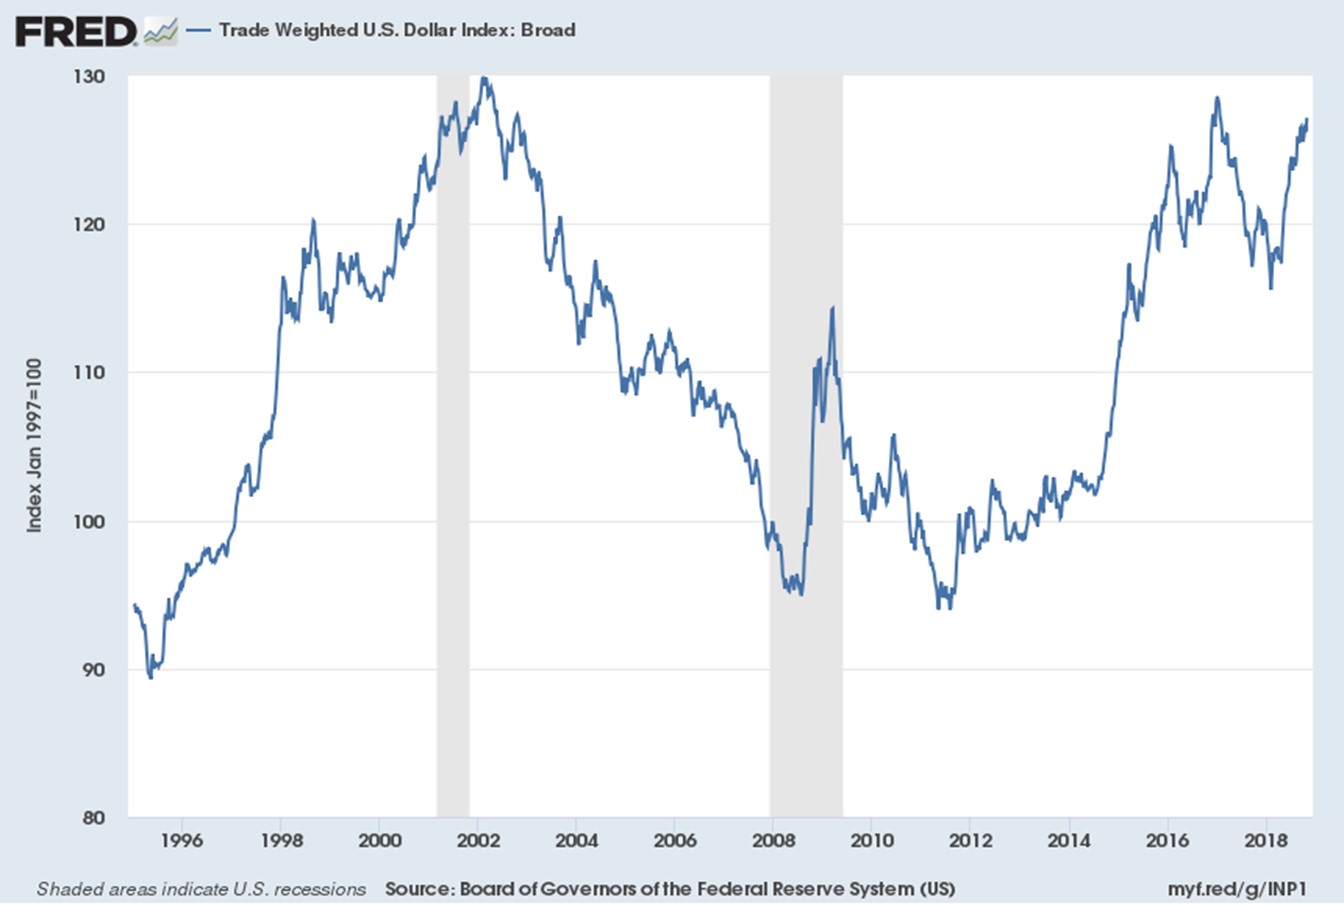
Compound the above with higher U.S. short-term rates and even more money should be attracted to U.S. dollar assets. This appears to be the case as shown in the next chart where the trade-weighted U.S. dollar has been rising since the summer of 2014 following the end of QE. Nothing new here!
What is new, however, is the continuing growth of the AWMB whereby banks are lending more money out along the yield curve and thereby holding the yield curve flat. This, in turn, is leading to the expectation of a pending recession. No doubt a recession will come eventually, but not anytime soon.
Bloomberg reports DJIA Earnings Growing Gangbusters, not so Barron’s
Meanwhile, the late 2017 U.S. tax changes have resulted in a substantial improvement in the reported earnings of the DJIA. Unfortunately, there is more than one way that the media have them tabulated.
Barron’s records the past 52 weeks trailing earnings at $1,173.40 and the P/E multiple at 20.83. These earnings include the poor results from Q4 2017 when many one-time write-offs were triggered by the new tax changes.
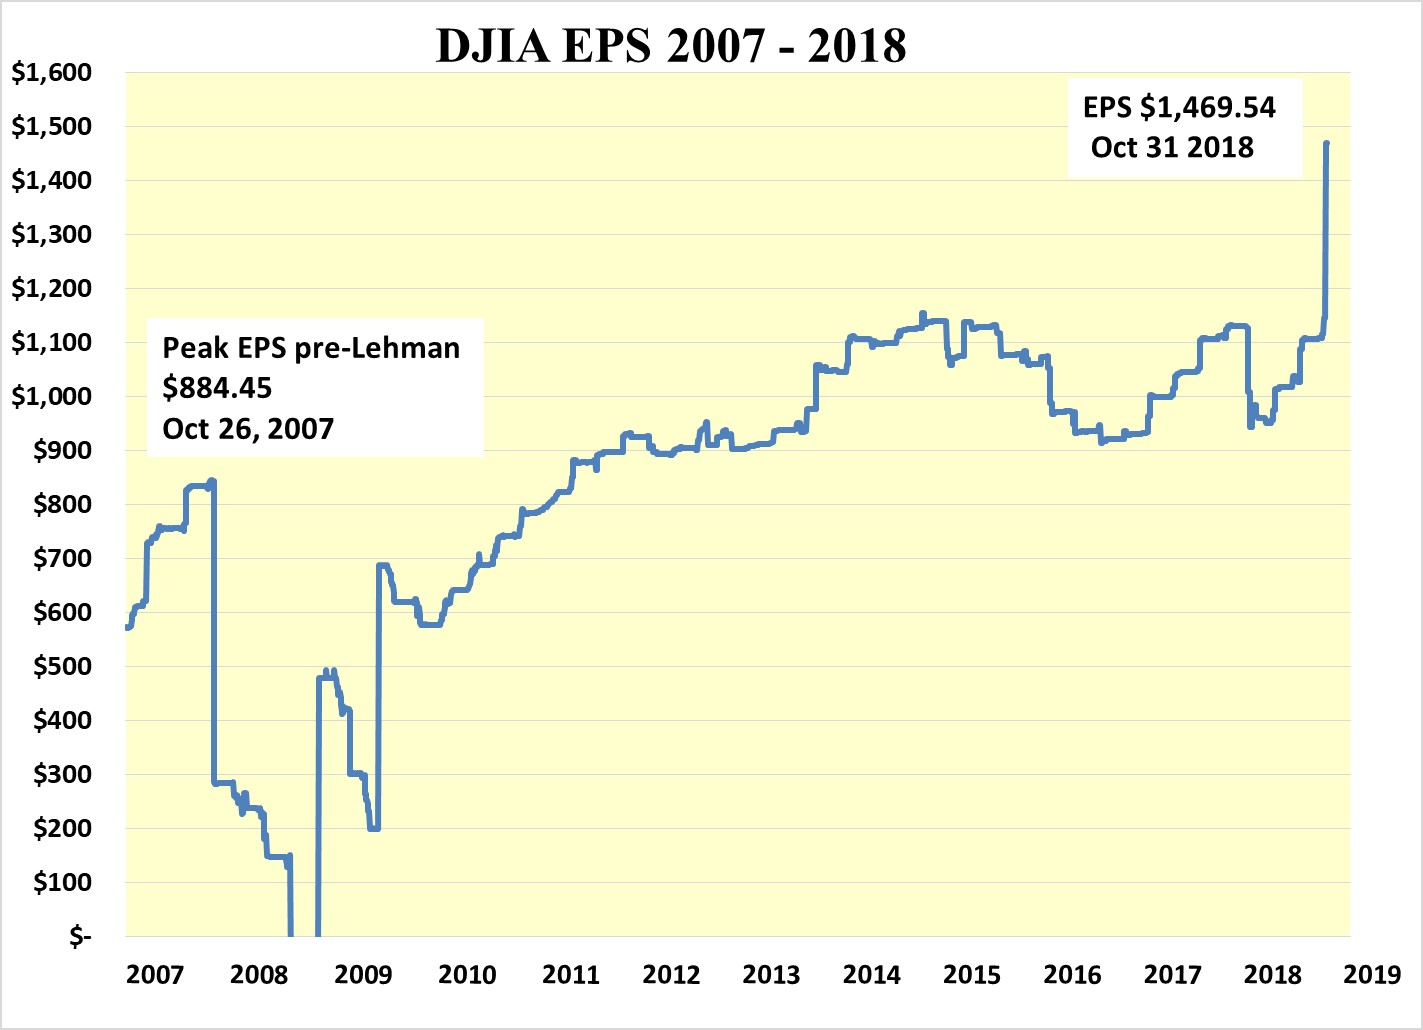
Bloomberg records the earnings as $1,469.54, 25% higher than Barron’s, and the P/E ratio at 16.64. The explanation would seem that the Bloomberg number is the annualized Q3 DJIA results reported thus far.
Going forward it seems certain that Q4 2018 DJIA results will be at least as good as Q3 and as these will replace the very poor Q4 2107 earnings in Barron’s 52-week trailing earnings, which will catch up with those of Bloomberg.
In light of this, it makes sense to use the latest Bloomberg numbers to show how much the DJIA earnings have benefitted from the U.S. Tax Act of 2017.
The Fed Valuation of the DJIA is 43,349
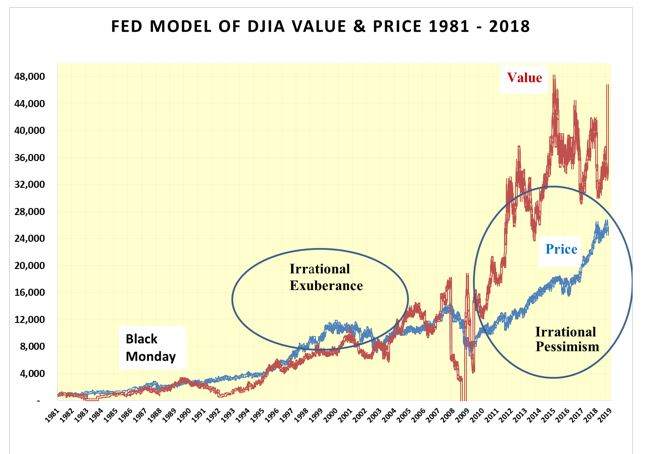
Using the above earnings in the Fed equity market valuation in the next chart demonstrates how the price of the DJIA at 25,115.76 is well below the Fed valuation of 43,349.
The DJIA Dividend Discount Value stands at 50,085
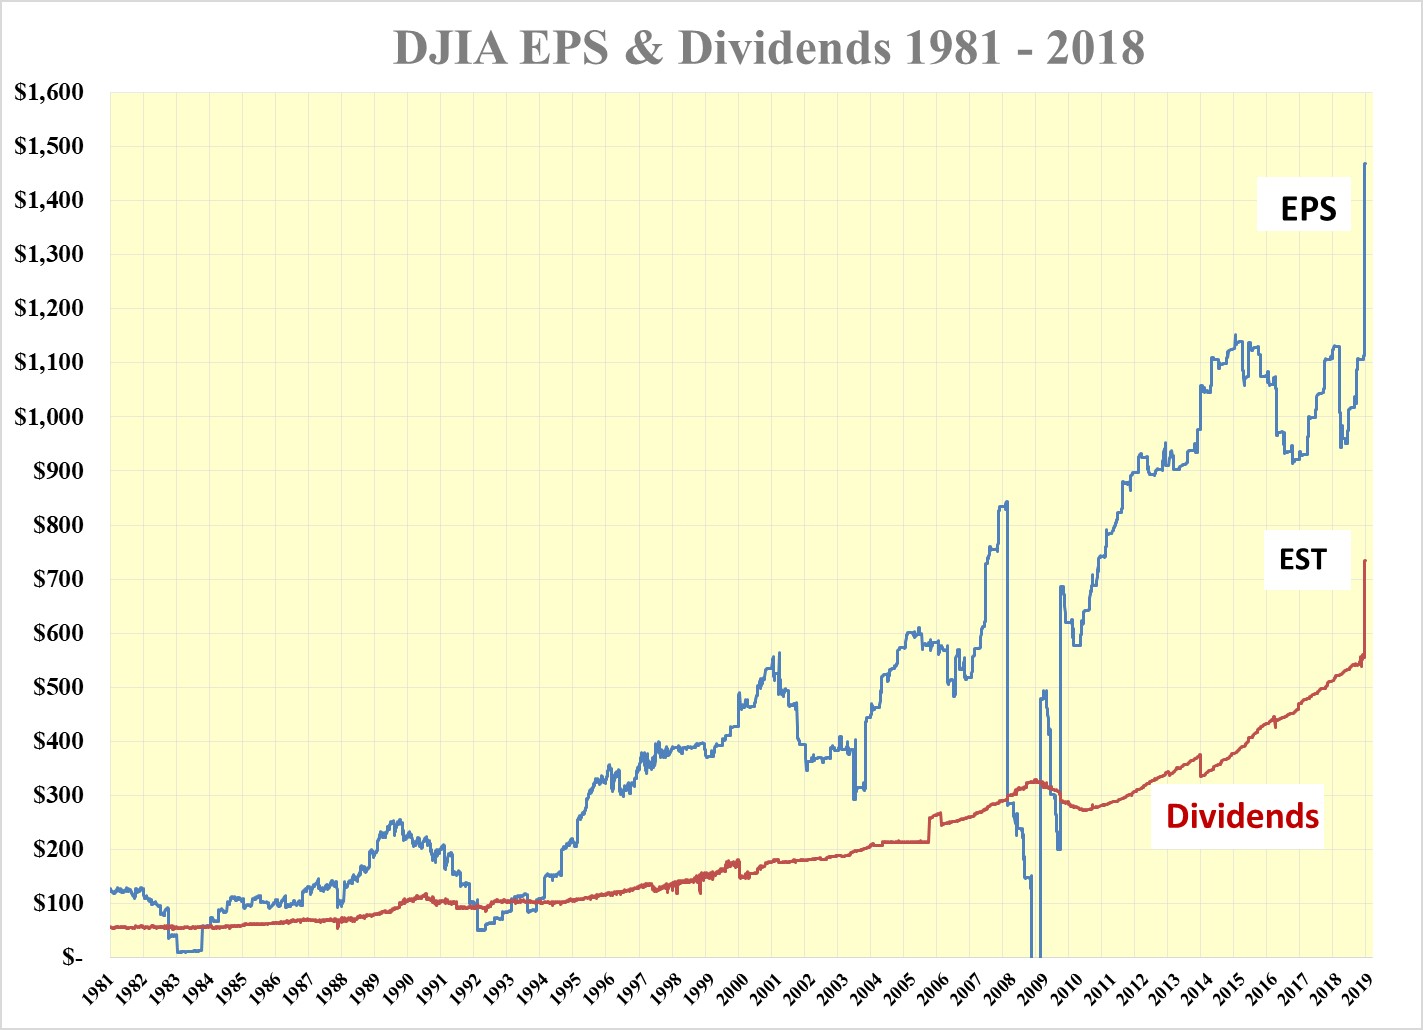
Assuming that earnings remain at the present level, and in all probability rise, it is not unreasonable to expect the DJIA dividend payout ratio of 50%. As the final quarter of the year unfolds the aggregate DJIA dividend should rise to approximately $735.
The dividend discount model is preferred to the Fed model because dividends have been much more stable than earnings over the past four decades
The two vectors that determine the dividend discount value, the yield of the 30 year T bond and the DJIA dividend are shown in the next chart. A falling 30 year T bond yield is positive for both bond prices and equity prices. A rising dividend is positive for equity prices. Of late the 30 year T bond yield has risen but the continuing rise of the AWMB should temper the rise. While this has had a negative influence on the dividend discount value the anticipated DJIA dividend increase should more than outweigh this.
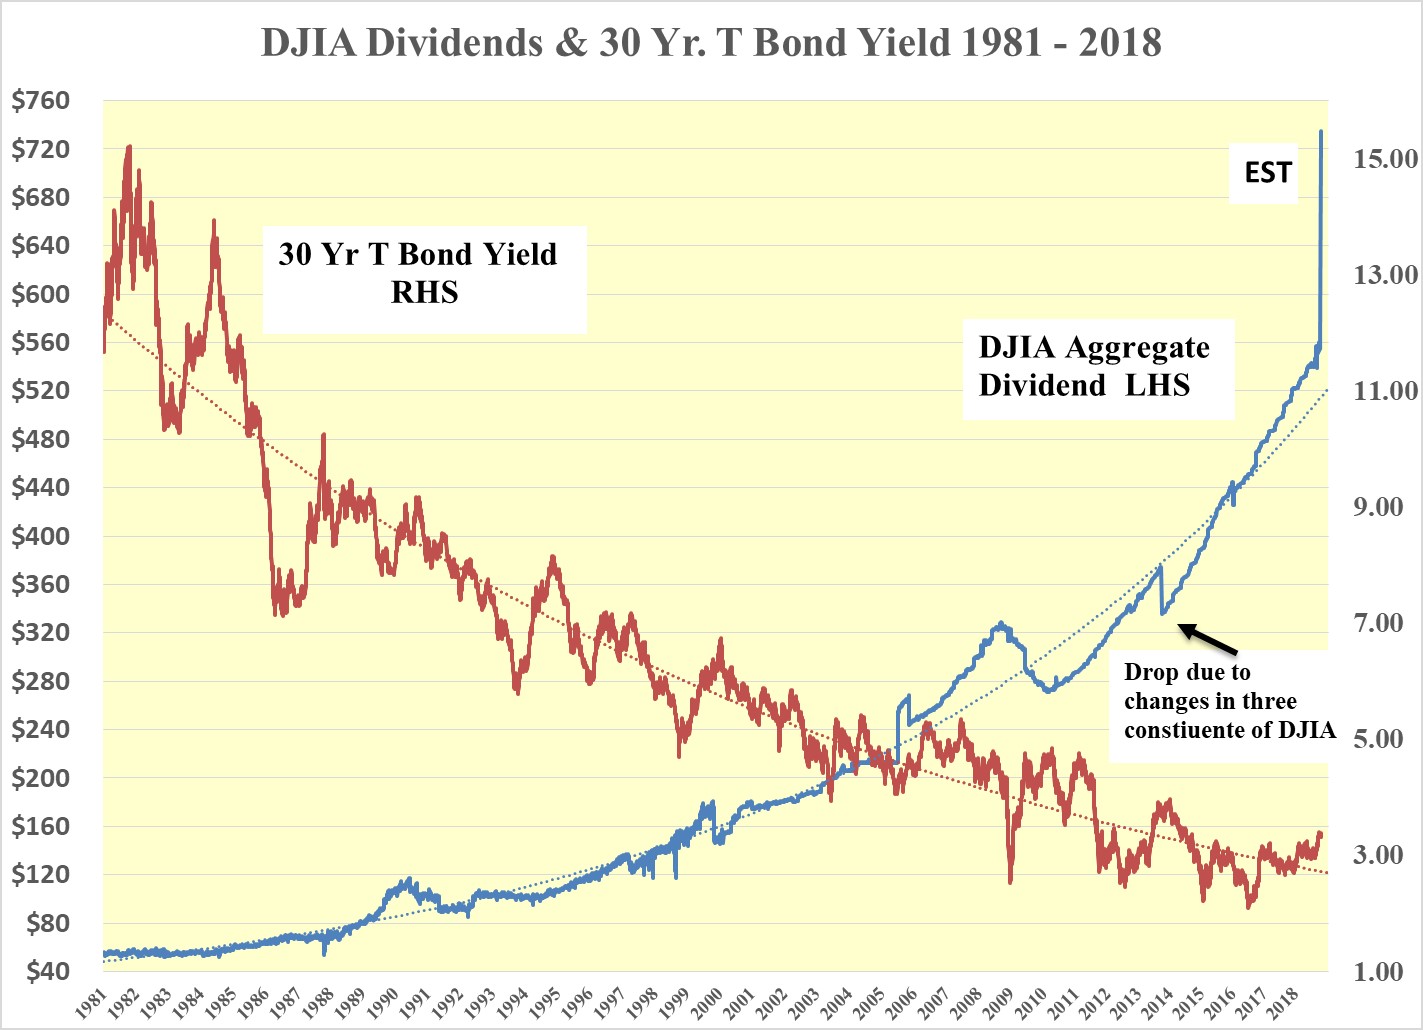
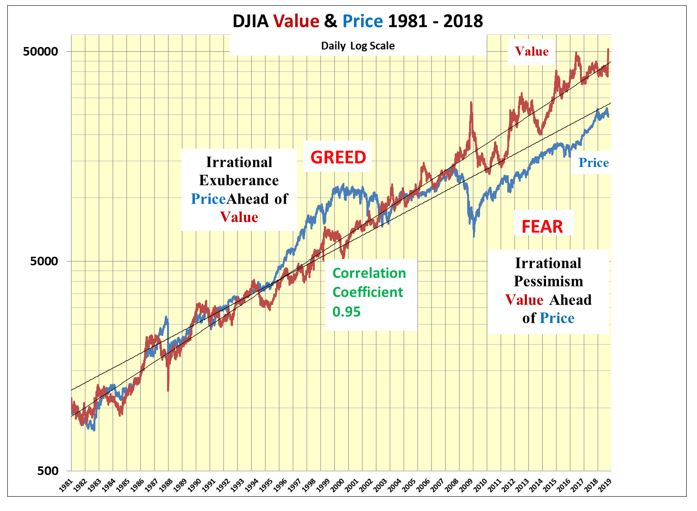
Since 1981 the value of the DJIA has benefitted from the positive impact of both vectors. The correlation between the dividend discount value and the price of the DJIA is 0.95, hence there is a high probability of the price of the DJIA rising strongly as the dividend of the DJIA starts to rise as it should through the end of 2018 and into 2019.
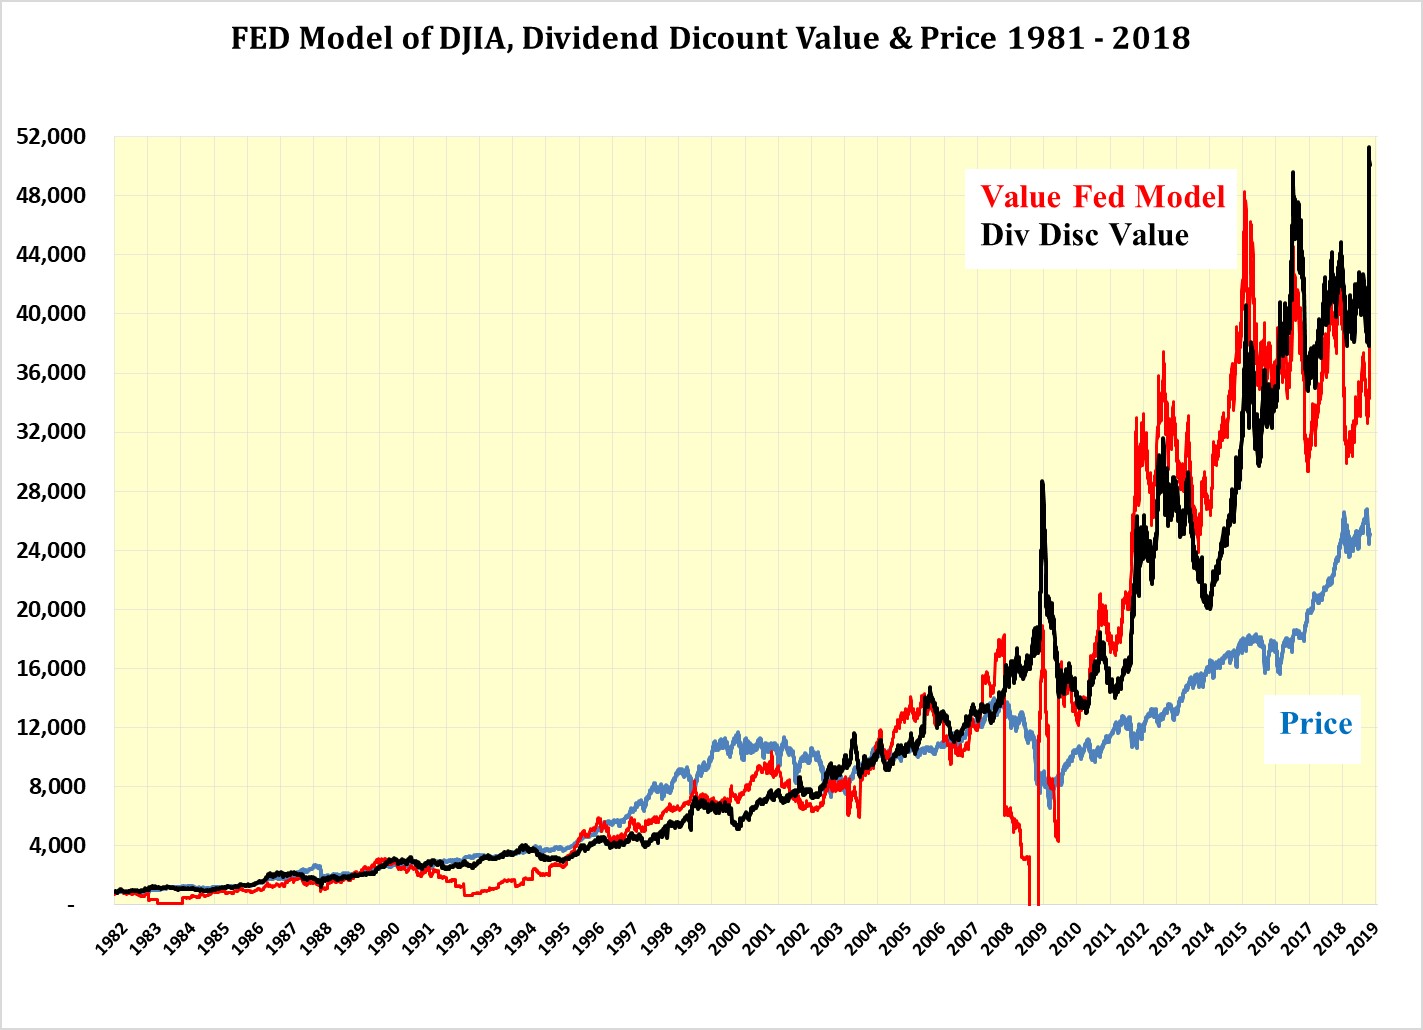
Combining the Fed model and the dividend discount model in the next chart it can be seen that both valuations are moving up strongly while the price of the DJIA of 25,115.76 is still well below both and as such the price of the DJIA continues to be under strong upward pressure.
The next chart shows how the dividend discount value of the DJIA and its price have performed since the peak of the DJIA in October 2007 on a log scale. The financial crisis and its aftermath stemmed from the near collapse of the banking system brought on by the greed and stupidity during the prior era of sub-prime mortgages, CDOs, CDS and all the other grossly over-leveraged portfolio Weapons of Mass Destruction.
One of the great things that took place was the buying opportunity in March 2009 when the dividend discount value of the DJIA stood at 20,470 and its price had sunk to 6,627 and the madness of marking portfolios to market ended terminating the downward spiral ended where sell begat selling.
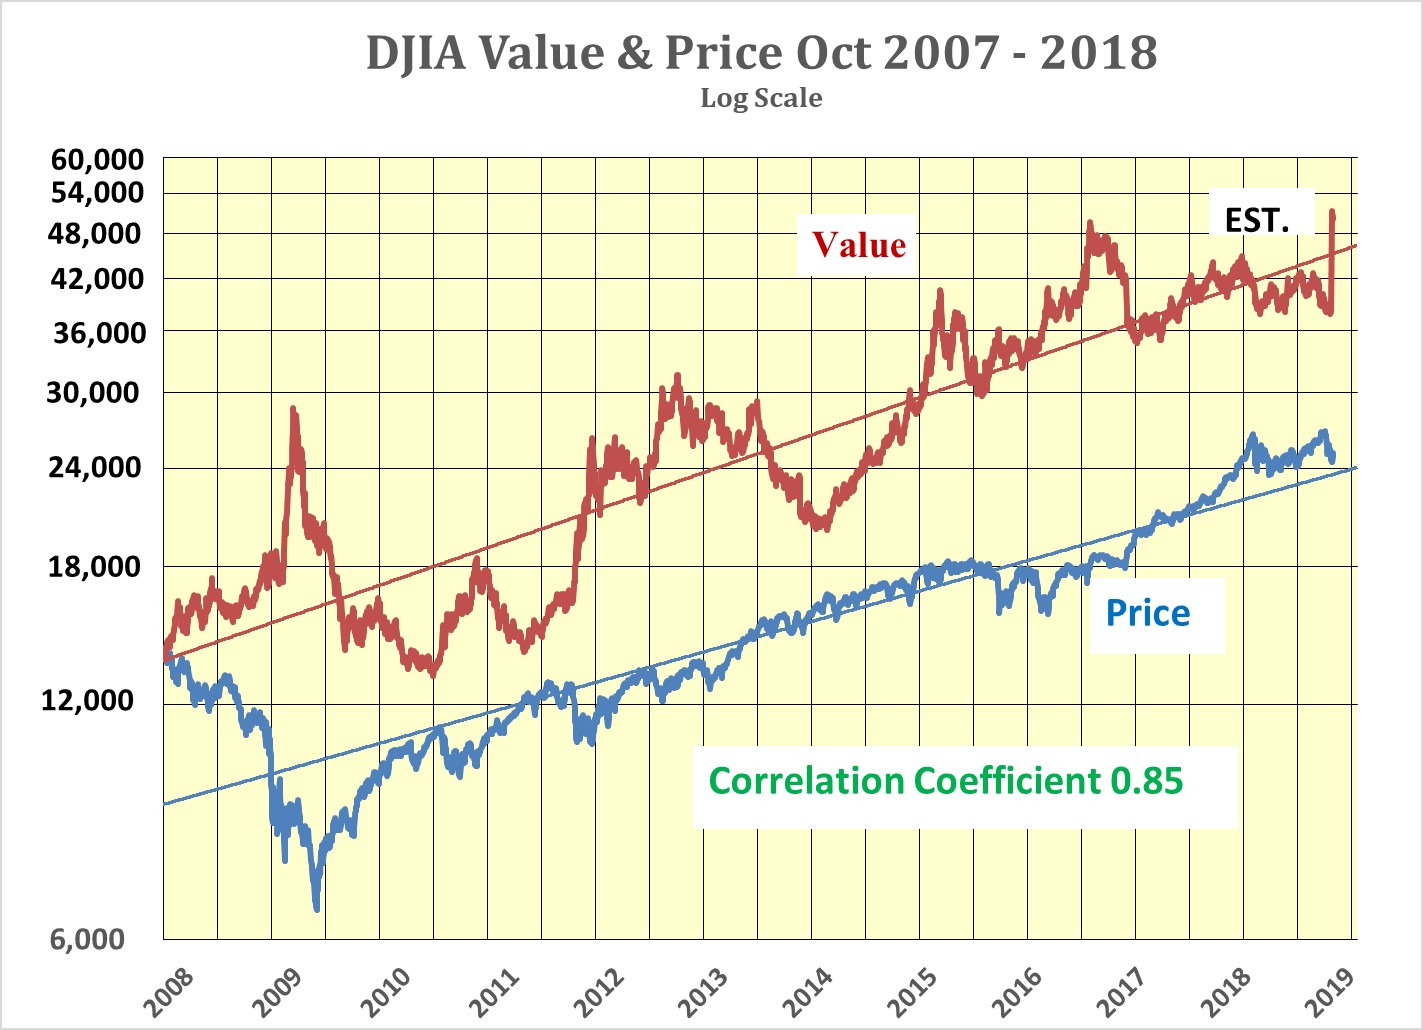
The divergence between the dividend discount value of the DJIA and its price is clearly demonstrated. The October sell-off was not justified. However, it provides yet another great buying opportunity. In July, I expected the price of the DJIA to reach 30,000 in the second half of 2018 when the magnitude of the benefits of the 2018 Tax Act was less clear. Today the outlook is much clearer and a DJIA price of 30,000 is now probable by year end. Even at such a price, the DJIA would still be 20,085 below its dividend discount value of 50,085 and the upward pressure on the price would continue.
Sources: Chart created by the author from FRED, Bloomberg and Dow Jones Data
Buy ahead of the mid-term elections while fear and pessimism abound and enjoy the ride well into 2019.
Disclosure: I have no positions in any stocks mentioned, and no plans to initiate any positions within the next 72 hours.
I wrote this article myself, and it expresses my own opinions. I am not ...
more


Trump is lying about tariff progress with China. He is desperate to win the house, so he can avoid impeachment and having to reveal his taxes.
This proves that Trump is likely lying about tariff progress. China will never, ever, bow down to this:
abcnews.go.com/.../us-charges-chinese-companies-trade-secrets-theft-58902900