
Deere & Co. Stock Price Developing Into A “Rounded Reversal” Pattern
Deere & Company (NYSE:DE) appeared consistently on our list of “Strong Stocks Getting Stronger” during the rally from $80 to the current peak near $112 but, during March, lengthy divergences undercut the rally as price stabilized into a range. We’re likely seeing a Distribution Arc, or more specifically a “Rounded Reversal” price pattern. [Let me explain what I mean.]
Written by Corey Rosenbloom (afraidtotrade.com)
The “Rounded Reversal” Pattern takes a while to set-up on a chart but can produce explosive results. Below is an unfolding example in real time:
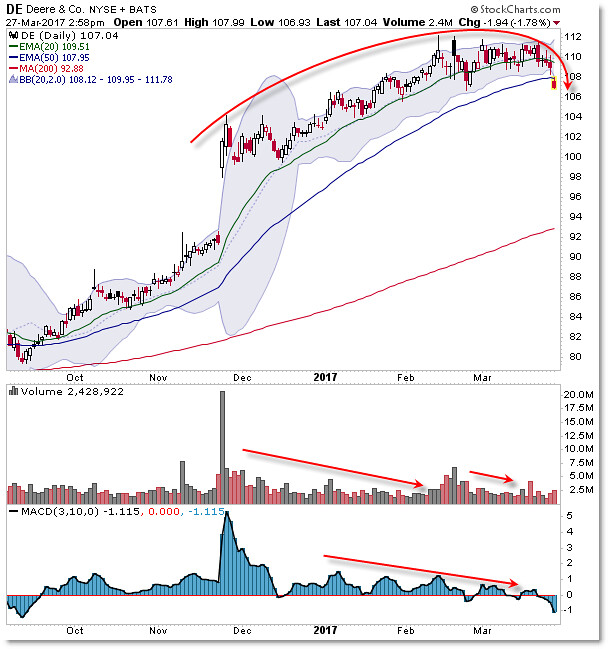
Yesterday's (Monday) breakdown beneath the rising 50 day EMA and lower Bollinger Band – especially on a gap – suggests the supply/demand relationship has changed to favor the bears...[so] continue focusing on additional movement beneath the 50 day EMA toward lower levels like $100 or even the rising 200 day SMA nearing $94.00 per share.
There’s never a guarantee that any pattern will work out perfectly, so this Rounded Reversal would be considered a failure – and today a Bear Trap – should price react higher (buyers step in aggressively) back above $110.
If you’re trading this, frame your trades in terms of these levels and if not, continue watching how this interesting pattern plays out this time.
This article may have been edited ([ ]), abridged (...) and reformatted (structure, title/subtitles, font) by the editorial team of munKNEE.com (Your Key to Making Money!) to provide a ...
more

