
Clayton Williams Energy - Chart Of The Day: November 6
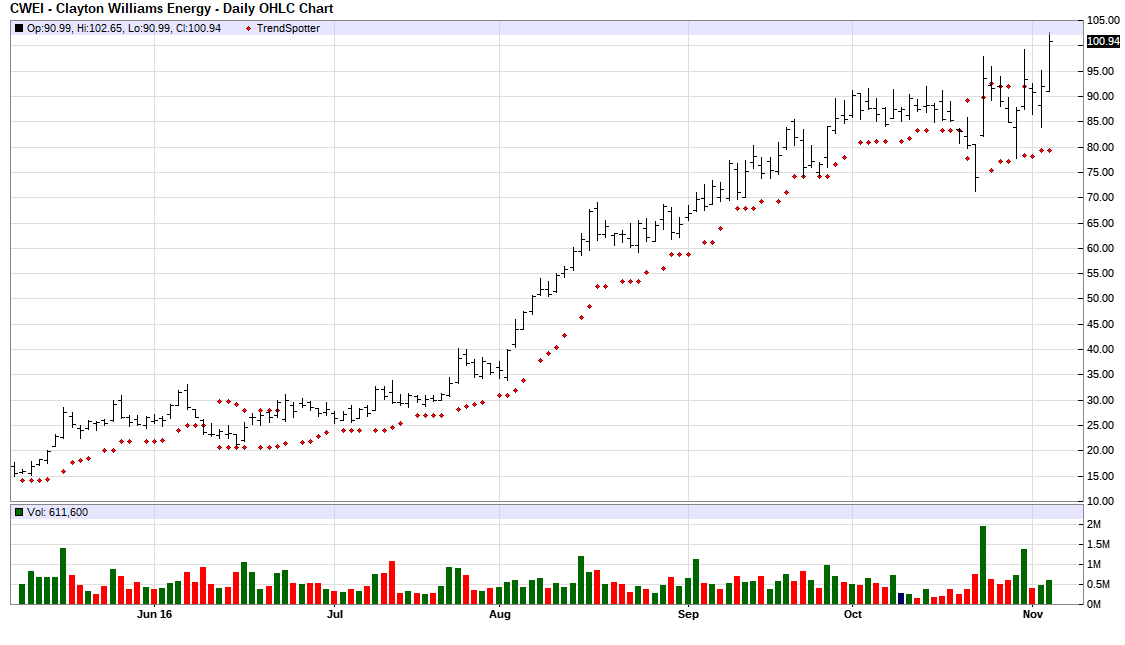
The Chart of the Day belongs to Clayton Williams Energy (Nasdaq: CWEI). I found the independent petroleum exploration stock by using Barchart to sort the Russell 3000 Index stocks first for the highest Weighted Alpha, then again or technical buy signals of 80% or more. Since the Trend Spotter signaled a buy on 11/1 the stock gained 8.06%.
Clayton Williams Energy is an independent oil and gas company engaged in the exploration for and development and production of oil and natural gas primarily in Texas, Louisiana and New Mexico. A significant portion of the company's proved oil and gas reserves are concentrated in the Cretaceous Trend, which extends from south Texas through east Texas, Louisiana and other southern states and includes the Austin Chalk, Buda, and Georgetown formations.
The status of Barchart's Opinion trading systems are listed below. Please note that the Barchart Opinion indicators are updated live during the session every 10 minutes and can therefore change during the day as the market fluctuates. The indicator numbers shown below therefore may not match what you see live on the Barchart.com web site when you read this report.
Barchart technical indicators:
- 100% technical buy signals
- Trend Spotter buy signal
- Above its 20, 50 and 100 day moving averages
- 5 new highs and up 15.72% in the last month
- Relative Strength Index 64.89%
- Technical support level at 93.72
- Recently traded at 100.94 with a 50 day moving average of 80.92
Fundamental factors:
- Market Cap $1.1 billion
- Revenue expected to grow 28.10% next year
- Earnings estimated to increase 52.60% next year
- Wall Street analysts issued 2 strong buy, 3 hold and 1 strong sell recommendation on the stock
Disclosure: None.


