
Citi Group- Bullish Breakout Taking Place
Citi Group (C) since 2007 highs is much lower in price. Over the past 18-months, it's a different story for Citi. Below looks at Citi this year and how it is attempting to breakout from a bullish pattern.
(Click on image to enlarge)
Over the past few months, Citi appears to have created another bullish ascending triangle. This pattern results in an upside breakout, two-thirds of the time.
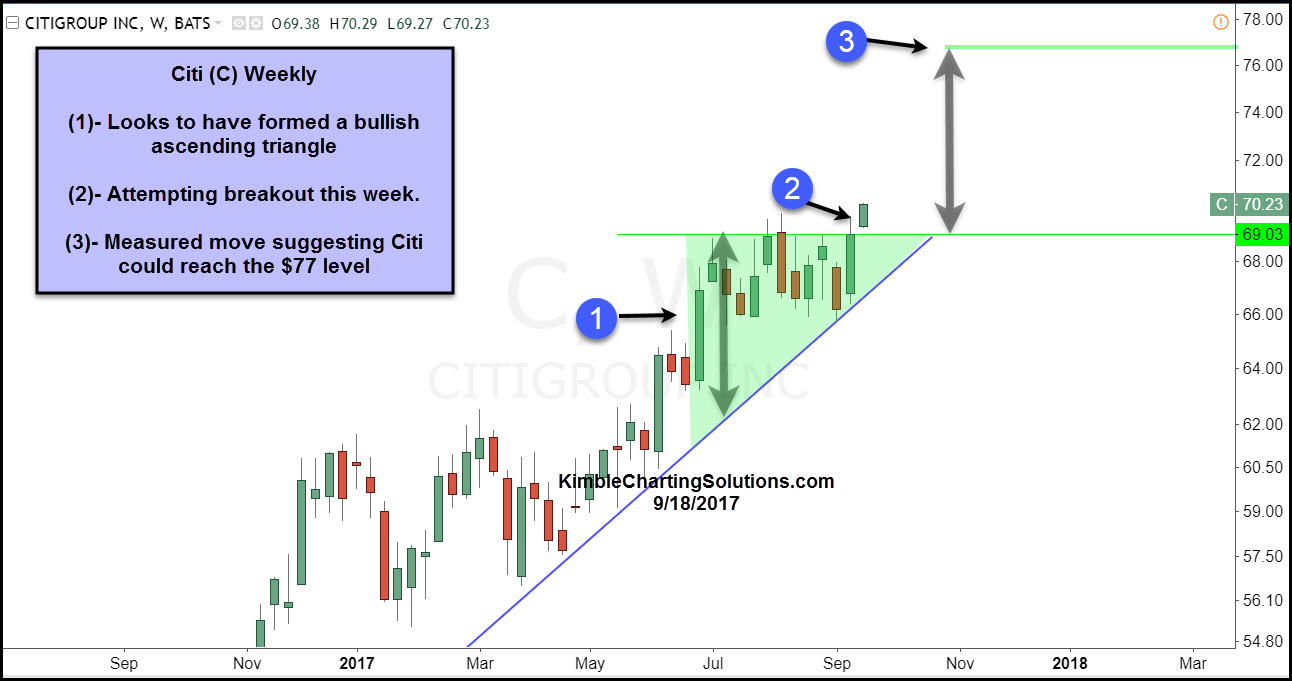
As mentioned above, Citi looks to have formed a bullish ascending triangle pattern at (1), where we applied a measured move calculation.
This week Citi is attempting to break out of the top of the pattern at (2). The measured move suggests that Citi could reach the $77 level, should it break out.
Sign up for Chris's Kimble Charting Solutions' email alerts--click here.


