
Chart Of The Day - RCS Capital (RCAP)
The Chart of the Day is RCS Capital (RCAP). I found the stock by sorting the All Time New High list for new high frequency in the last month and the stock was right at the top of the list. Since the Trend Spotter signaled a buy on 12/23 the stock gained 120.06%.
(click to enlarge)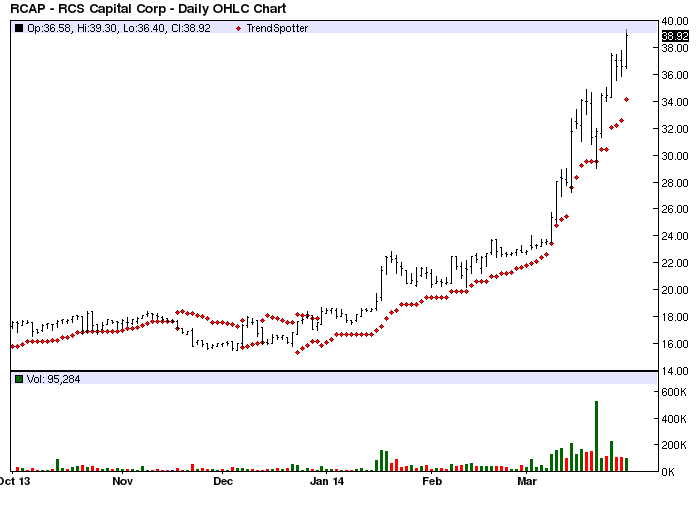
Barchart's Opinion trading systems are listed below. Please note that the Barchart Opinion indicators are updated live during the session every 10 minutes and can therefore change during the day as the market fluctuates. The indicator numbers shown below therefore may not match what you see live on the Barchart.com web site when you read this report.
Barchart technical indicators:
- 96% Barchart technical buy signals
- Trend Spotter buy signal
- Above its 20, 50 and 100 day moving averages
- 14 new highs and up 71.00% in the last month
- Relative Strength Index 80.52%
- Barchart computes a technical support level at 35.31
- Recently traded at 38.92 with a 50 day moving average of 25.45
Fundamental factors:
- Market Cap $97.30 million
- P/E 34.00
- Dividend yield 1.97%
- Revenue predicted to grow 11.80% this year and another 8.30% next year
- Earnings estimated to decrease 5.370% this year and increase by 4.70% next year
- Only 1 Wall Street analyst follows the stock and he recommends a buy
This stock gets far more attention than its projections merit. You should consider this a technical play only and be prepared to bail on signs of weakness.
None.


