
Chart Of The Day- Alibaba
Today lets talk about BABA. I want to talk about it for a few reasons. One is from an educational point due to multiple technical analysis patterns that are building here. I say building because they still need chart time to complete.
The other reason is that there is going to come a time when this whole bull market cycle ends and there is going to be a lot of action on the short side.
Remember the YELP chart from a few weeks back?

IF you start to see a lot of the characteristics and patterns showing up as shown below then at the least you'll be prepared in advance vs being a deer in the headlights if you will.
Now if you don't short sell it doesn't matter because you still need to know "What To Watch Out For" if you are long and that is where the educational part for you comes into play. IF you are long only and you start seeing patterns like I am going to talk about then for you its a great education for when the time comes to not only get out before something falls apart on you but also what to stay away from with regards to going long.
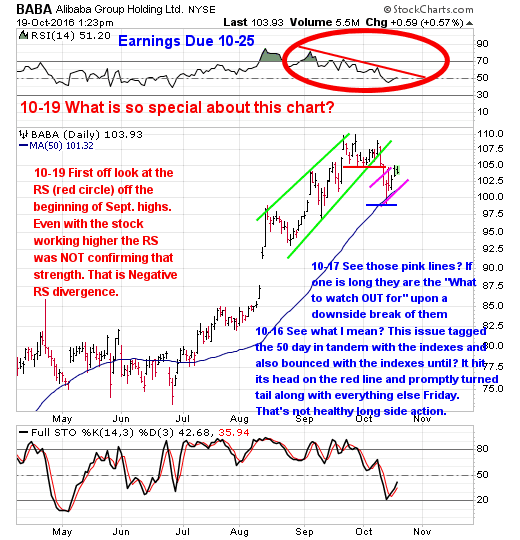
Take a look at BABA here.
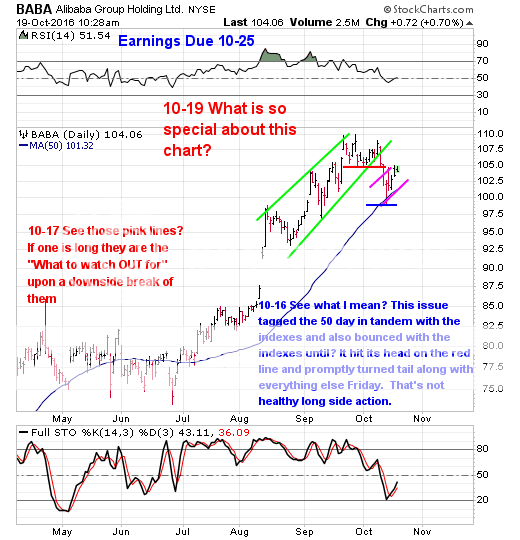
Now take a look at it
Now lets zoom in a little closer and look at the short term 30 minute time frequency charts here.
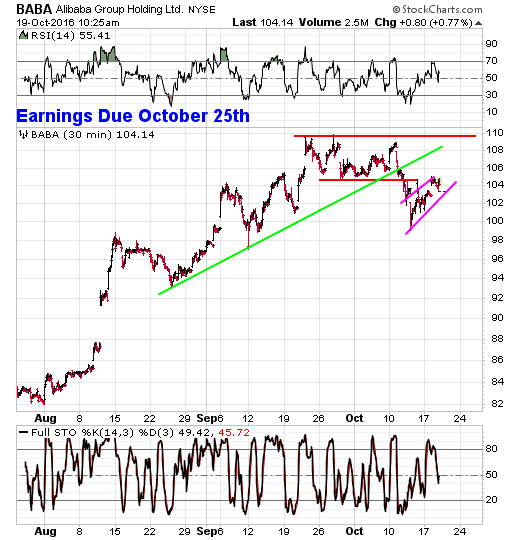
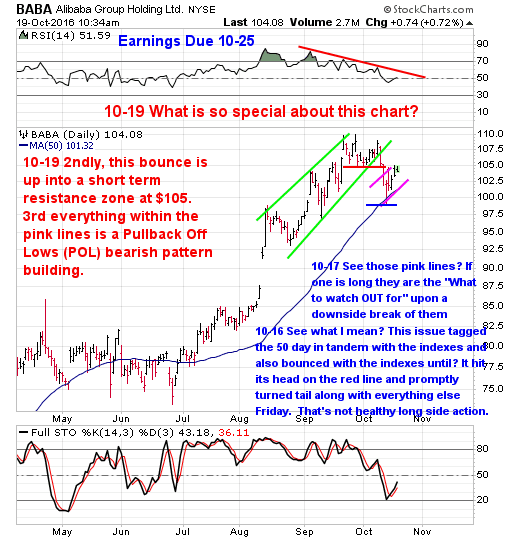
As you can see with the chart above since breaking to the downside of the green uptrend channel this issue has thus far only been able to snap back up into "Old support (at the red line) once broken tends to become new resistance". Pretty straightforward basic technical analysis folks. At this point its really just a matter of whether this issue respects this resistance zone. If not, then $108 or even a full blown retest of the highs could be in order but that's just fluctuation risk upon an entry as both zones are resistance as well.
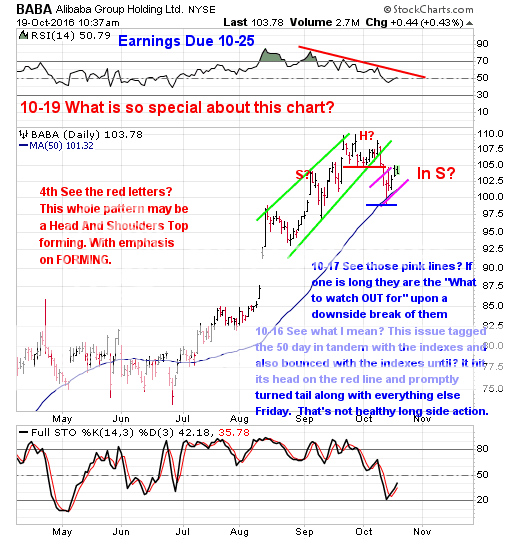
Below we see the makings of a Head And Shoulders Topping pattern BEING BUILT and not completed. You can obviously see what LOOKS to be a right shoulder forming. Its just a matter of breaking to the downside. A downside break with conviction is the "What To Watch For" when it comes to confirming a breakdown of the pink Pullback Off Lows (POL) snapback rally.

In the chart notes I mentioned if it wasn't for earnings being so close I'd consider shorting it here and that's still the way I feel about it, what you do is up to you as a lot of life is a choice. HOWEVER, IF one were to short it here? Then a few things come into play.
1. Be OUT before earnings are released. IN FACT BE OUT NO MATTER WHAT BEFORE EARNINGS ARE RELEASED, whether you have gains or not IF taking a trade on the short side here. Note: Check to make sure of the earnings date because these chinese stocks are iffy on release dates, This release date s according to zacks.
2. A retest of the highs is at $110.00 and that is your fluctuation risk upon a short sell in here. In other words this issue could walk back up there and you'd be down in an issue sitting at resistance. That zone is, call it 6 points away or -6% of fluctuation risk upon a position sizing of no more that 5-7% of ones overall portfolio should one take the trade in here.
3. The other risk is that of a being ran higher INTO earnings. IF that is going to occur you'll know it when the stock wakes up to the upside and crossed over the $105 zone. IF one were to short it here and that occurs? Its a pretty tight stop.
So you see, what I've tried to do is lay out both what to watch for and out for based upon chart pattern recognition all for future reference at the least because as we all know patterns repeat!
Hope this helps.
Disclosure: None.


Thanks for the wonderful sharing