
Best S&P 500 Basic Materials Stocks: Consider Dow Chemical
The basic materials sector has been the best performer sector in 2016 increasing 29.4%, while the S&P 500 Index has grown 9.5%, and the Nasdaq Composite Index has gained 7.5% in this period. As I see it, basic materials stocks could continue to outperform the broad market in the next few quarters.
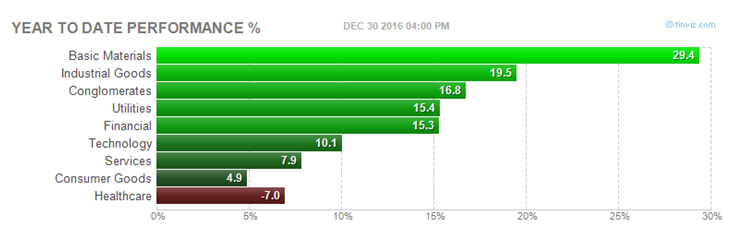
Source: finviz.com
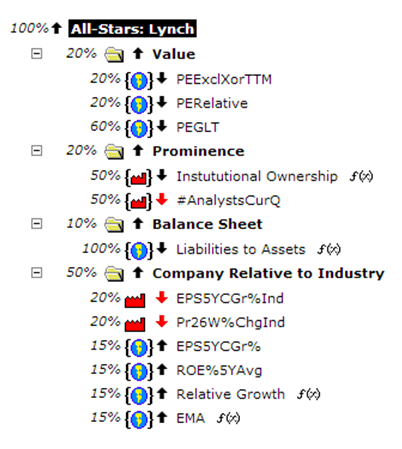
A Ranking system sorts stocks from best to worst based on a set of weighted factors. Portfolio123 has a powerful ranking system which allows the user to create complex formulas according to many different criteria. We also have highly useful several groups of pre-built ranking systems, I used one of them, the “All-Stars: Lynch,” in this article. The ranking system is based on investing principles of the well-known investor Peter Lynch.
The “All-Stars: Lynch” ranking system is quite complex, and it is taking into account many factors like trailing P/E, relative P/E, PEG ratio, institutional ownership, liabilities, sales growth and EPS growth, as shown in our chart below.
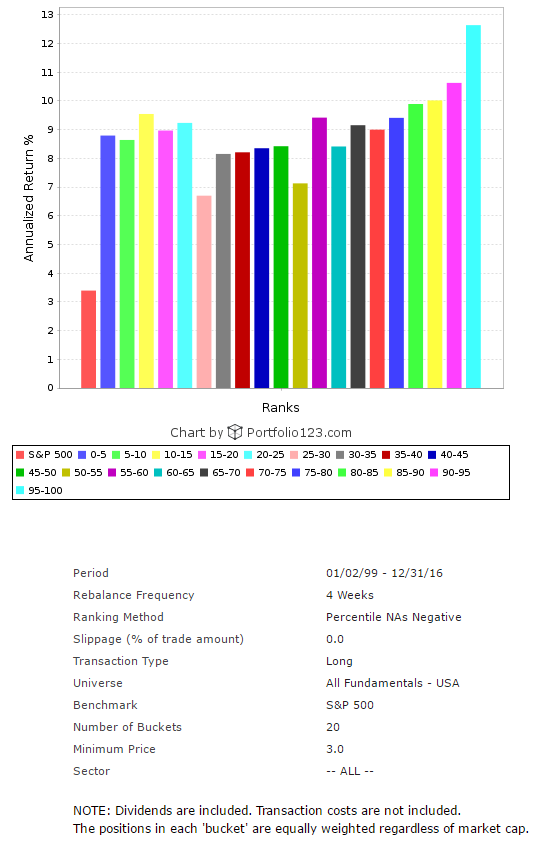
In order to find out how such a ranking formula would have performed during the last 18 years, I ran a back-test, which is available in the Portfolio123's screener. For the back-test, I took all the 6,218 stocks in the Portfolio123 database.
The back-test results are shown in the chart below. For the back-test, I divided the 6,218 companies into twenty groups according to their ranking. The chart clearly shows that the average annual return has a very significant positive correlation to the “All-Stars: Lynch” rank. The highest ranked group with the ranking score of 95-100, which is shown by the light blue column in the chart, has given by far the best return, an average annual return of 12.6%, while the average annual return of the S&P 500 index during the same period was 3.4% (the red column at the left part of the chart). Also, the second and the third group (scored: 90-95 and 85-90) have given superior returns. This brings me to the conclusion that the ranking system is very useful.
After running the "All-Stars: Lynch " ranking system for all S&P 500 basic materials companies, on December 31, 2016, I discovered the twenty best basic materials stocks, which are shown in the table below. In this article, I will focus on the first ranked stock; The Dow Chemical Company (DOW).
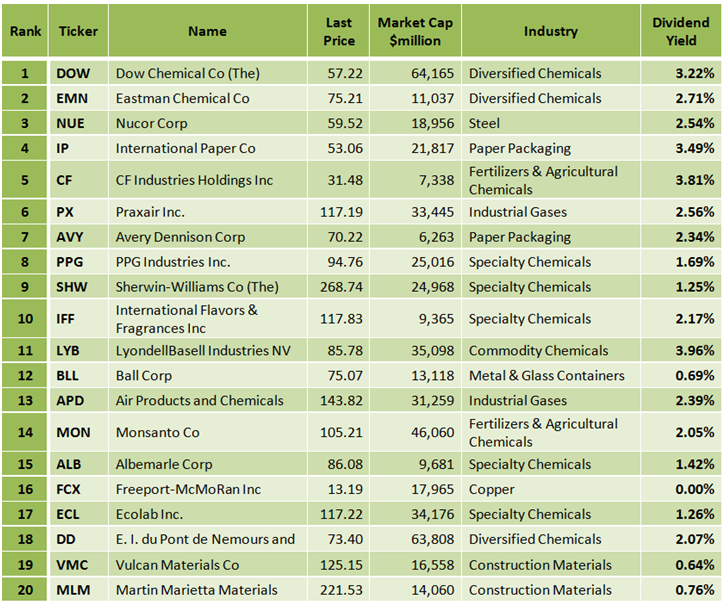
The Dow Chemical Company
On October 27, Dow Chemical, the biggest U.S. chemical maker by sales, reported its third quarter 2016 financial results, which beat EPS expectations by a big margin of $0.12 (15.2%). Net sales for the quarter were at $12.5 billion, up 4% year over year. DOW showed earnings per share surprise in all its twelve last quarters, as shown in the table below.

In the report, Andrew N. Liveris, Dow’s chairman and chief executive officer, stated:
“We have now achieved four full years – 16 consecutive quarters – of year-over-year operating earnings growth and margin expansion, during which time Dow has also delivered three consecutive years of volume growth. We accomplished all of this in the face of a persistently slow-growth global economic environment. Our increasingly consumer markets-oriented portfolio was once again on display, with strong results reported in the businesses that serve the packaging, automotive, electronics, construction and agriculture markets. In our newest business addition – Dow Corning’s silicones business – we delivered double-digit earnings growth, while disciplined execution yielded synergies ahead of plan. And finally, we were pleased with the ongoing advancement of our strategic growth investments, most notably the successful startup of the largest unit at our Sadara joint venture and steady progress on our Texas ethylene plant, which is now more than 85 percent complete.”
DOW Stock Performance
Since the beginning of 2016, DOW's stock is up 11.1% while the S&P 500 Index has increased 9.5%, and the Nasdaq Composite Index has increased 7.5%. Since the beginning of 2012, DOW's stock has gained 99%. In this period, the S&P 500 Index has increased 78%, and the Nasdaq Composite Index has risen 106.6%. According to TipRanks, the average target price of the top analysts is at $64.67, which indicates an upside of 13% from its December 30 close price, which appears reasonable in my opinion.
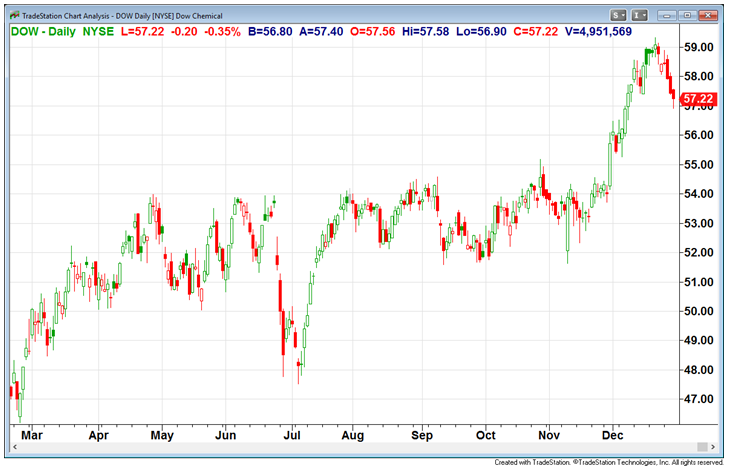
DOW Daily Chart
DOW Weekly Chart
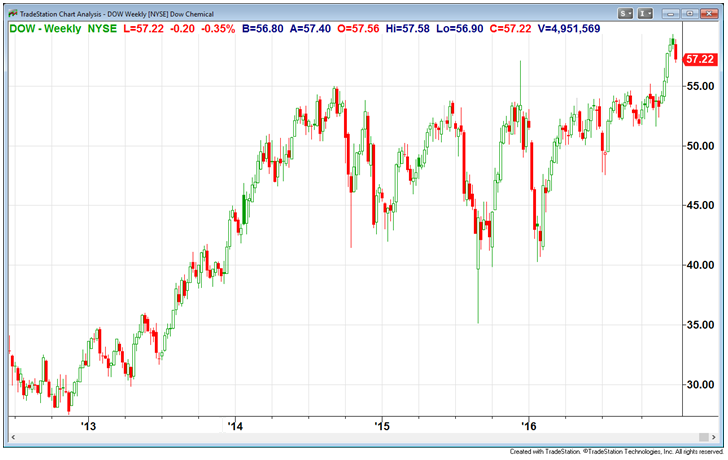
Charts: TradeStation Group, Inc.
Valuation
DOW's valuation is good, the trailing P/E is very low at 8.36, and the forward P/E is low at 14.13. The price to sales ratio is at 1.38, the price to cash flow is at 6.08, and the Enterprise Value/EBITDA ratio is low at 8.79.
The annual dividend yield is pretty high at 3.22% and the payout ratio is only 27.2%. The annual rate of dividend growth over the past three years was at 4.8%, and over the past five years was very high at 22.9%. Dow started to raise dividends in June 2011, after decreasing its dividend payments at the beginning of 2009 due to the 2008 world economic crisis.
Summary
Dow delivered strong third quarter 2016 results, which beat EPS expectations by a significant margin. Last quarter was the 16th quarter in a row in which the company achieved operating earnings and margin growth. What's more, Dow showed earnings per share surprise in all its twelve last quarters. Dow's valuation metrics are very good, and the company is generating strong free cash flows and pays a generous dividend currently yielding 3.22%. The average target price of the top analysts is at $64.67, which indicates an upside of 13% from its December 30 close price, which appears reasonable in my opinion.


