
Applied Materials Looks Undervalued
When a fundamentally sound business goes through temporary weakness, this can be a great buying opportunity for investors. Applied Materials (AMAT) stock is under pressure due to lower-than-expected revenue guidance last quarter, but business prospects look as strong as ever in the long term, and the stock is priced at conveniently low valuation levels.
Statistical research has proven that quantitative factors such as financial quality, value, momentum, and relative strength are powerful return drivers for stocks. Applied Materials stock looks like a strong alternative for investors when considering these variables.
A Solid Business
Applied Materials is a global leader in semiconductor fabrication equipment, as well as tools for manufacturing flat-panel displays and organic light-emitting diodes, or OLEDs. With over 33,000 systems installed, Applied Materials benefits from scale advantages and access to all kinds of valuable data from its customers, which provides a key source of competitive advantage for the company.
The semiconductor industry is remarkably volatile, and semiconductor fabrication equipment is even more so. Short-term fluctuations in financial performance are unavoidable in the sector, but Applied Materials has done a great job at increasing revenue, free cash flow, and earnings per share over the long term.
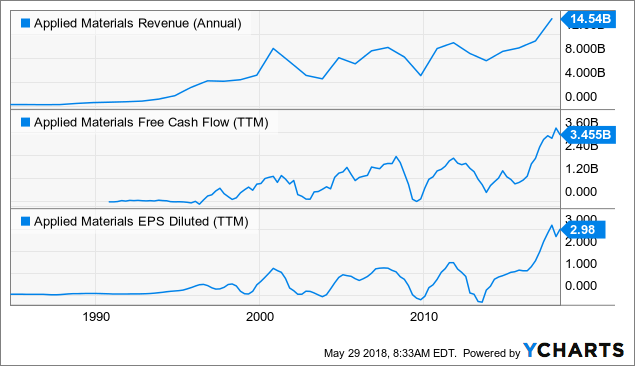
AMAT Revenue (Annual) data by YCharts
The company's numbers for the second quarter of fiscal year 2018 were remarkably strong, with many key indicators reaching record levels during the period.
Total revenue amounted to $4.57 billion, increasing 29% versus the same quarter last year. Operating profit margin expanded substantially, to 29.1% of sales versus 26.5% in the second quarter of fiscal year 2017. Adjusted earnings per share came in at $1.22, expanding by 54% year over year.
Sales guidance for the third quarter of fiscal 2018 was below expectations, though, mostly due to a weak outlook in the displays segment. Management is expecting revenue to be in the range of $4.33 billion to $4.53 billion, while analysts were forecasting $4.54 billion in sales for that quarter.
The midpoint of the range would be an increase of approximately 18% year over year, so financial performance is expected to remain quite healthy in the middle term. However, market expectations tend to have a big impact on stock prices, and guidance numbers were below expectations last quarter.
On the other hand, long-term trends such as Artificial Intelligence and Big Data could be powerful growth driver for Applied Materials over the years ahead.

Source: Applied Materials
Attractive Valuation
Current valuation levels for Applied Materials look clearly compelling. The stock is trading at a forward price to earnings ratio around 10.9, this is a huge discount versus a forward price to earnings ratio of 16.5 for the average company in the S&P 500 index.
The chart below shows key valuation ratios for Applied Materials in comparison to industry peers such as ASML Holding (ASML), KLA-Tencor (KLAC), IPG Photonics (IPGP), and Synopsys (SNPS).
Looking at indicators such as price to earnings, forward price to earnings, price to earnings growth, price to sales, and price to free cash flow, Applied Materials is clearly undervalued in comparison to industry peers.
| Ticker | P/E | Fwd P/E | PEG | P/S | P/FCF |
| AMAT | 12.76 | 10.89 | 0.7 | 3.24 | 16.82 |
| ASML | 33.51 | 24.64 | 1.57 | 7.8 | 42.9 |
| KLAC | 11.26 | 13.07 | 0.7 | 4.57 | 19.98 |
| IPGP | 32.09 | 26.18 | 2.67 | 8.99 | 42.93 |
| SNPS | 63.22 | 21.26 | 6.32 | 4.48 | 43.64 |
A Proven Ability To Outperform Expectations
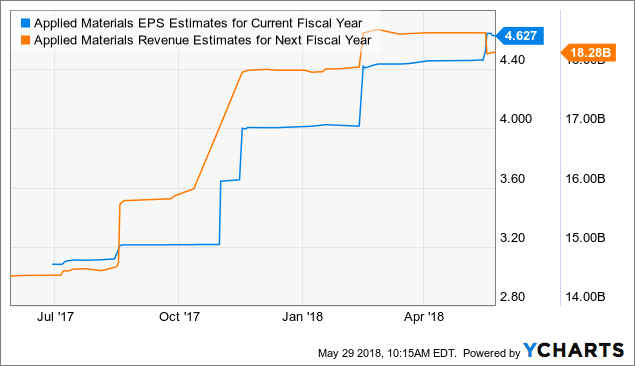
Fundamental performance in comparison to market expectations can have a huge impact on a stock. When a company is delivering better-than-expected numbers and forward-looking expectations are also moving upwards, this generally means the stock price is moving in the right direction too.
Applied Materials has an impressive track-record of delivering financial performance above Wall Street expectations in the long term. The company has exceeded expectations in every quarter since the third quarter of 2013. This level of consistency is quite unusual for companies in such a cyclical industry.
The chart below shows how earnings estimates for the current year and next fiscal year have evolved over the past 12 months. Estimates for next year came down a little bit after the most recent earnings report, but business momentum remains clearly strong over the middle term.
AMAT EPS Estimates for Current Fiscal Year data by YCharts
Relative Strength: Long-Term Strong And Short-Term Weak
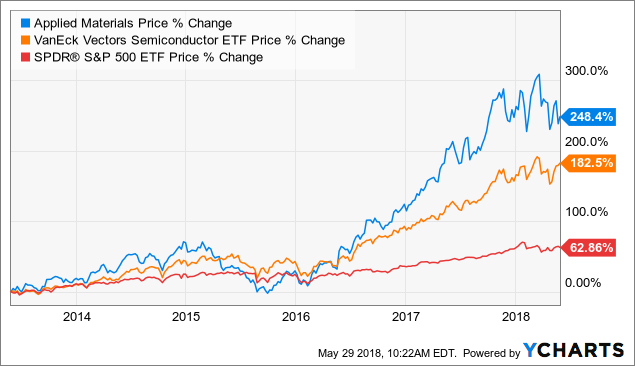
Money has an opportunity cost, when you buy a stock with mediocre returns, that capital is not available for investing in companies with superior potential. Besides, winners tend to keep on winning in the stock market, so you want to invest in stocks that are not only doing well but also doing better than other alternatives.
Applied Materials has materially outperformed relevant benchmarks such as SPDR S&P 500 ETF (SPY) and VanEck Vectors Semiconductor ETF (SMH) in the past five years.
AMAT data by YCharts
On a short-term basis, on the other hand, relative strength leaves much to be desired, since the stock is significantly lagging the sector-specific ETF.
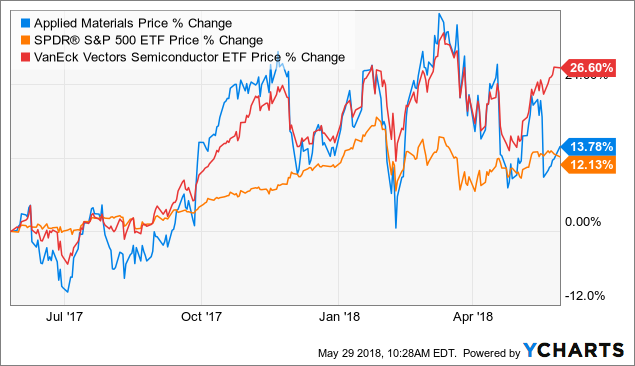
AMAT data by YCharts
Putting It All Together
The PowerFactors system is a quantitative investing system available to members in my research service, "The Data Driven Investor." This system basically ranks companies in a particular universe according to the factors analyzed in this article for Applied Materials: financial quality, valuation, momentum, and relative strength.
The system has produced solid backtested performance over the long term. The chart below shows how the 50 stocks with the highest PowerFactors ranking in the S&P 500 index performed in comparison to the SPDR S&P 500 ETF since 1999. The backtesting assumes an equal-weighted portfolio, monthly rebalanced, and with an annual expense ratio of 1% to account for trading expenses.
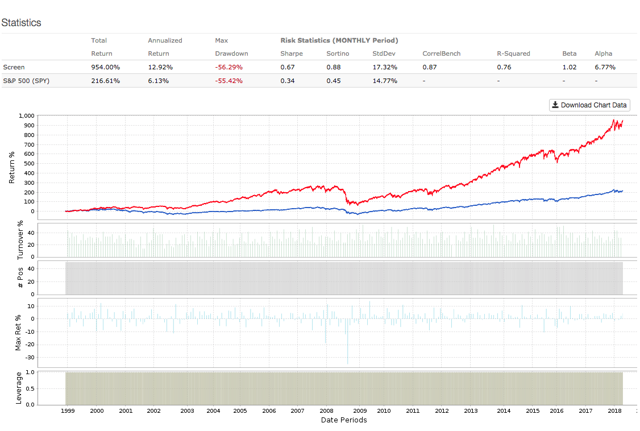
Data from S&P Global via Portfolio123
The system more than doubled the benchmark, with annual returns of 12.92% per year versus an annual return of 6.13% for the market-tracking ETF in the same period. In cumulative terms, the system gained 954% versus 216.61% for the benchmark.
Applied Materials is one of the 50 stocks currently picked by the system, which means the company is among the best 10% of those in the S&P 500 based on a combination of quantitative indicators that measure financial quality, valuation, business momentum, and relative strength.
The stock looks particularly attractive in terms of valuation, since it's priced at levels substantially below both the market as a whole and the industry in particular.
Applied Materials operates in a volatile industry, and this means that financial performance can be hard to predict in the short term. However, the business looks clearly solid on a long-term basis, and the stock is offering compelling upside potential from current price levels.
Disclosure: I/we have no positions in any stocks mentioned, and no plans to initiate any positions within the next 72 hours.
Disclaimer: I wrote this article myself, and it expresses my ...
more

