
And…We’re Back Where We Started
As I noted on Thursday, the Fed non-announcement gave the bulls a reason to charge back into the markets as “accommodative monetary policy” is once again extended through the end of the year.
It is not surprising the Fed once again failed to take action as their expectations for economic growth were once again lowered. In fact, as I have noted previously, the Federal Reserve are the worst economic forecasters on the planet.
As shown in the table/chart below, not only are the expectations for economic growth now the lowest on record, the Fed has given up on 2% growth for the economy with the long-run economic projections now at just 1.9%.
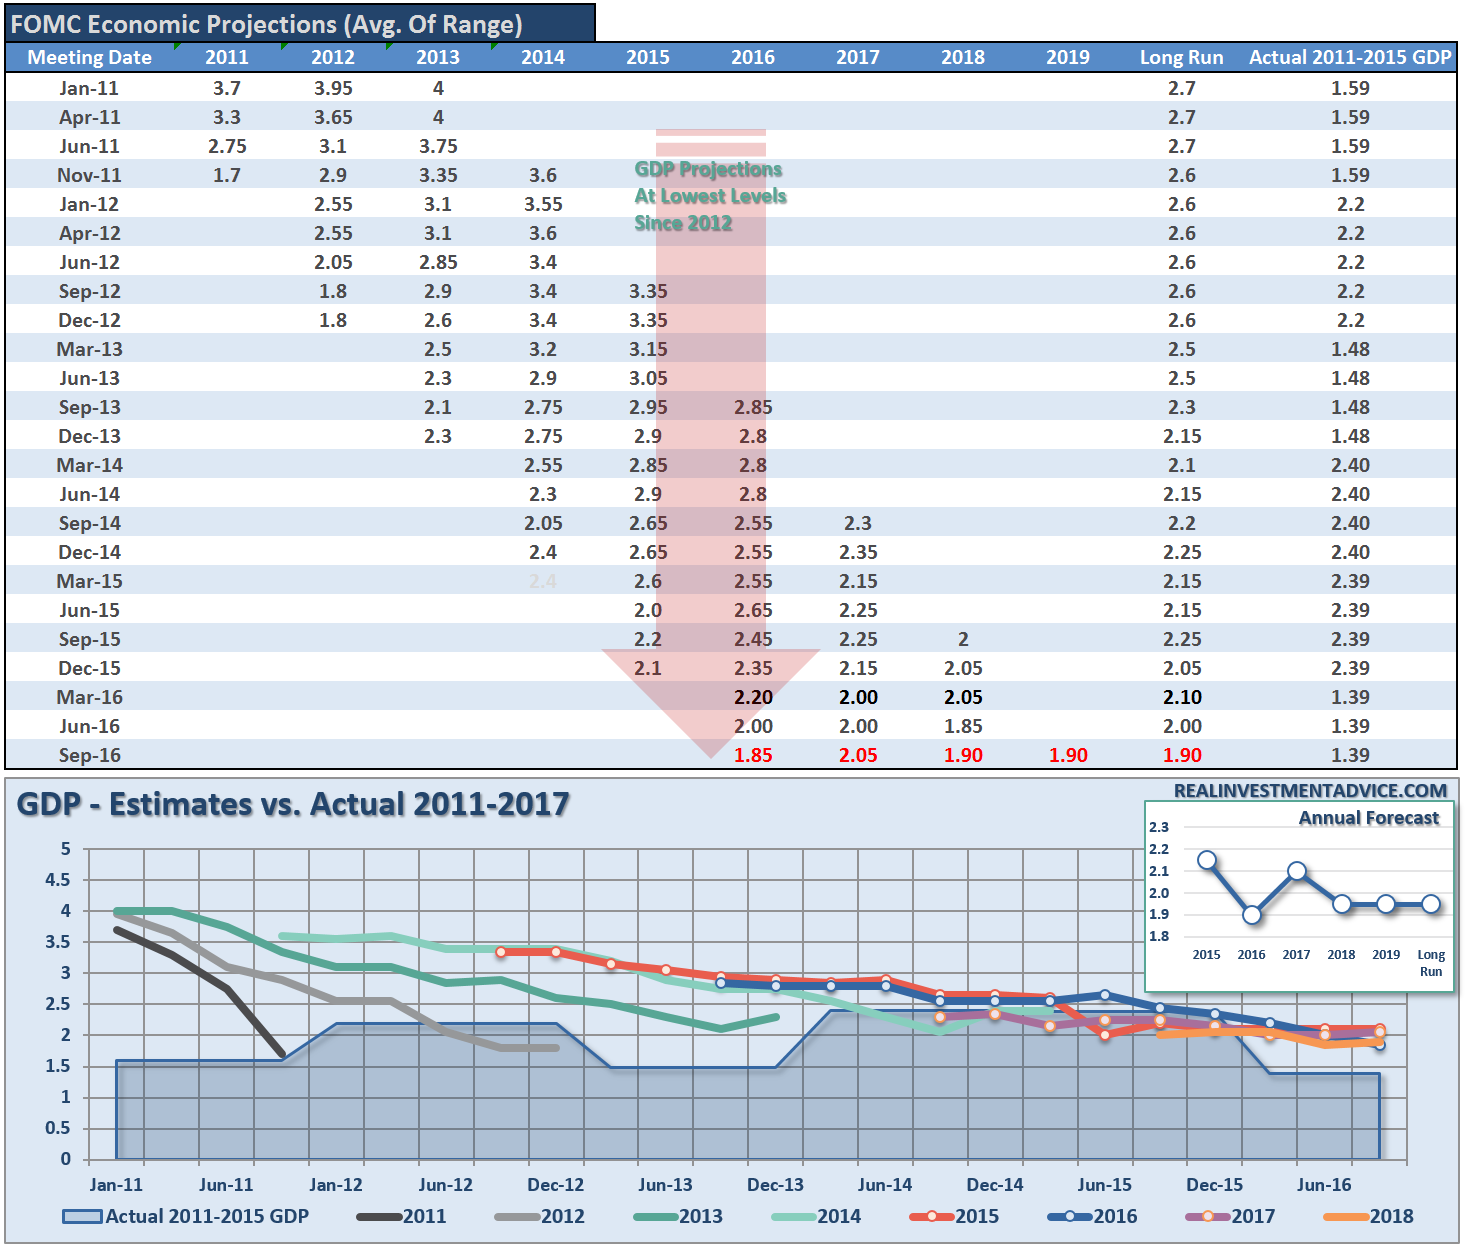
This should surprise no one. The Federal Reserve has continued to hope for the last several years that extremely “accommodative” monetary policy, near zero interest rates, would spark stronger levels of economic activity leading to a rise in broad-based inflationary pressures. Unfortunately, this has yet to be the case.
More on that last point in a moment.
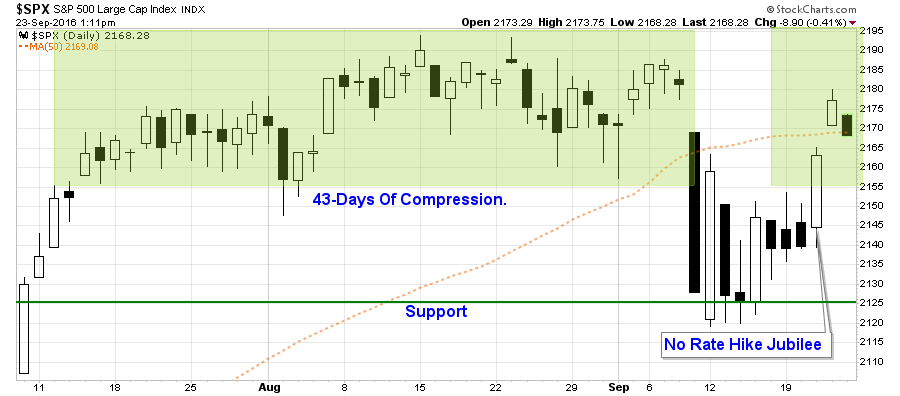
With the Fed holding still on hiking rates, with a promise to now hike in December(*****cough***** bull#$%#****cough), traders came rushing back into the market pushing prices right back into the trading range of the last month.
Consequently, the volatility index was also smashed back to its recent lows as “fear” has been completely eliminated for now.
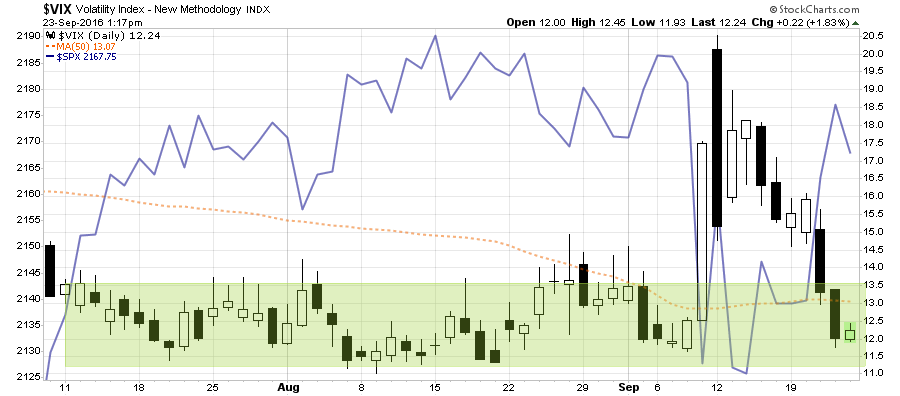
Basically, if you strip out the past week of volatility, nothing really changed.
For the bulls, there is some good news here.
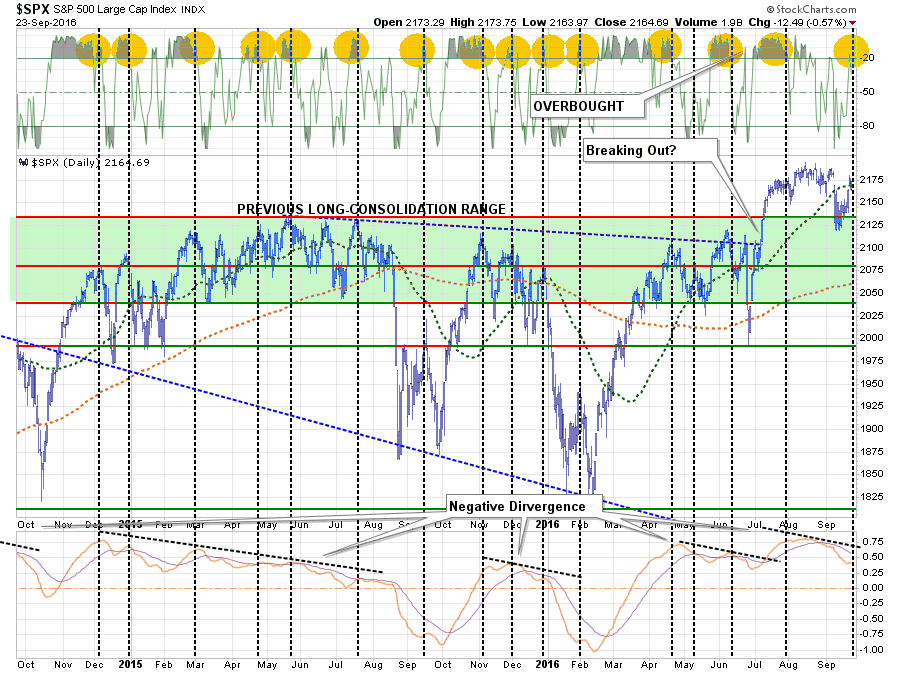
The recent breakdown in the market, has so far, completed a successful retest of the “breakout” that occurred earlier this year. This pullback to support does confirm the“bullish trend” from February is still intact. However, given the long consolidation of prices this summer, a breakout to new highs is needed to confirm a bullish advance higher.
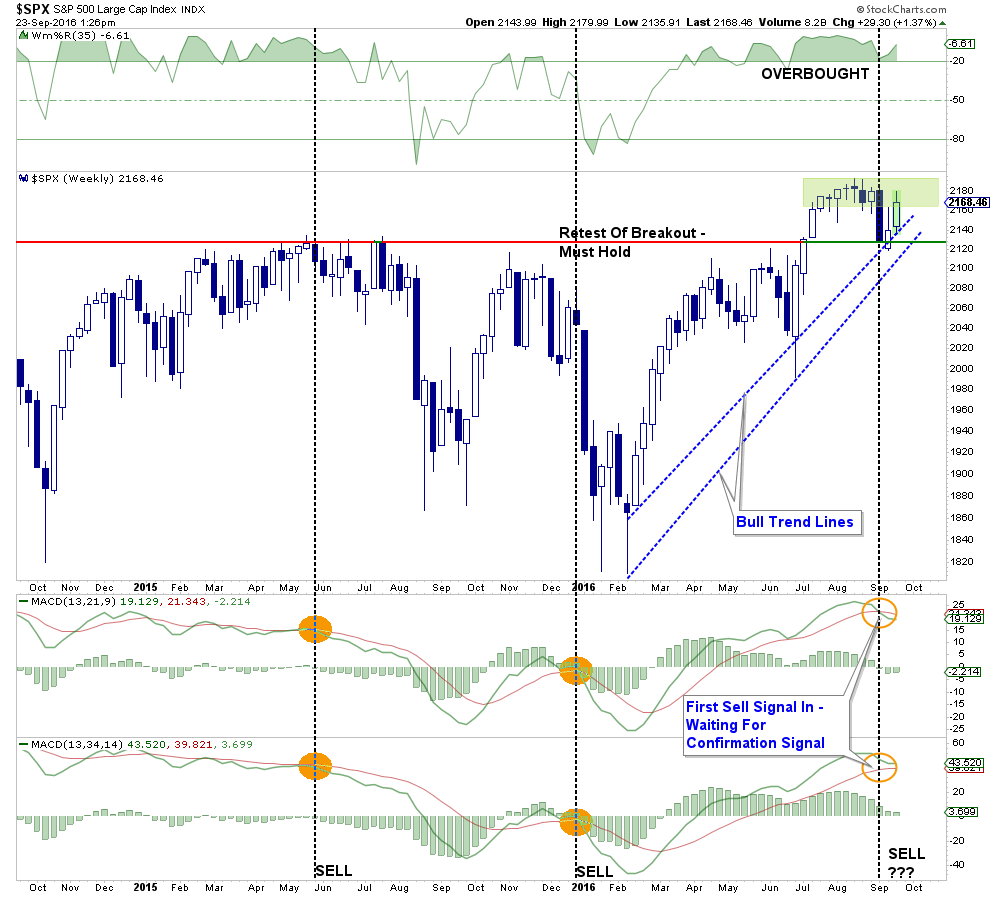
The breakout to new highs will also be needed to reverse the initial sell signal that has currently been registered. Such a reversal will also confirm the bullish trend remains intact. The problem is the sell signal is occurring at very high levels which suggest that any potential upside remains extremely limited for now.
For the bears, there are also points to be made.
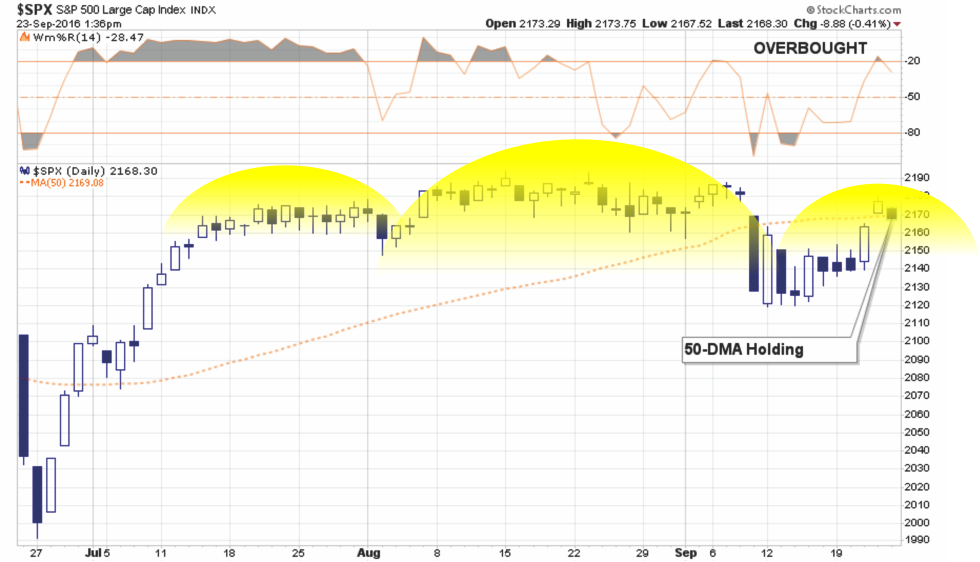
First, the market never resolved much of its overbought condition that existed previously. This overbought condition, combined with the lower sell signal, limits upside to the markets currently. This is why I continue to recommend caution.
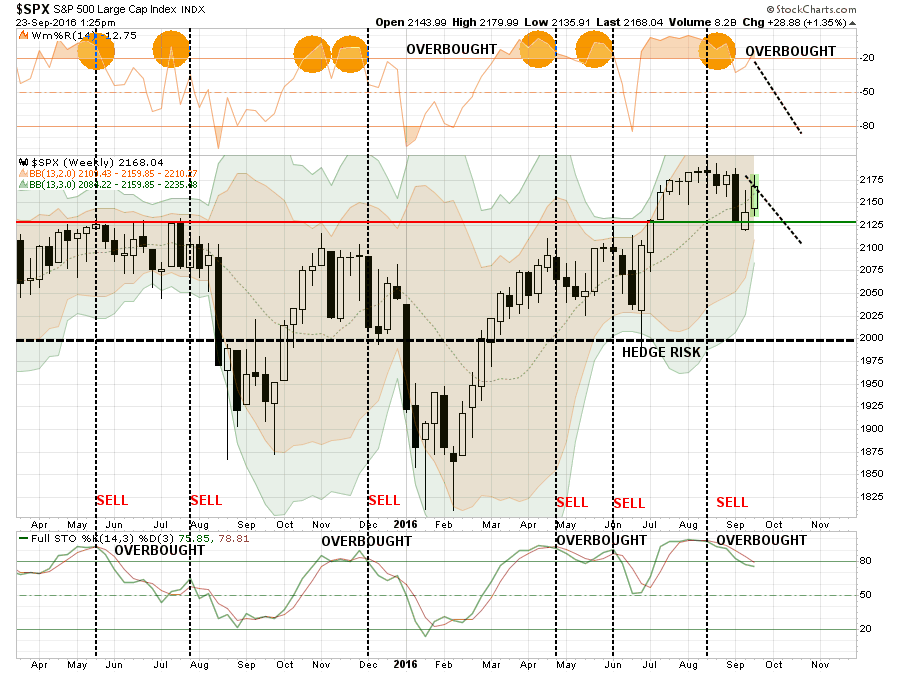
Also, it will be important for the markets to regain their footing and continue to move higher. The yellow highlights are suggesting a more important topping process may be in play, a “head and shoulder” pattern, which again suggests downside risk may be more prevalent.
While the bulls and bears can fight over who is potentially going to be correct, I am going to keep portfolio models steady into the next week.
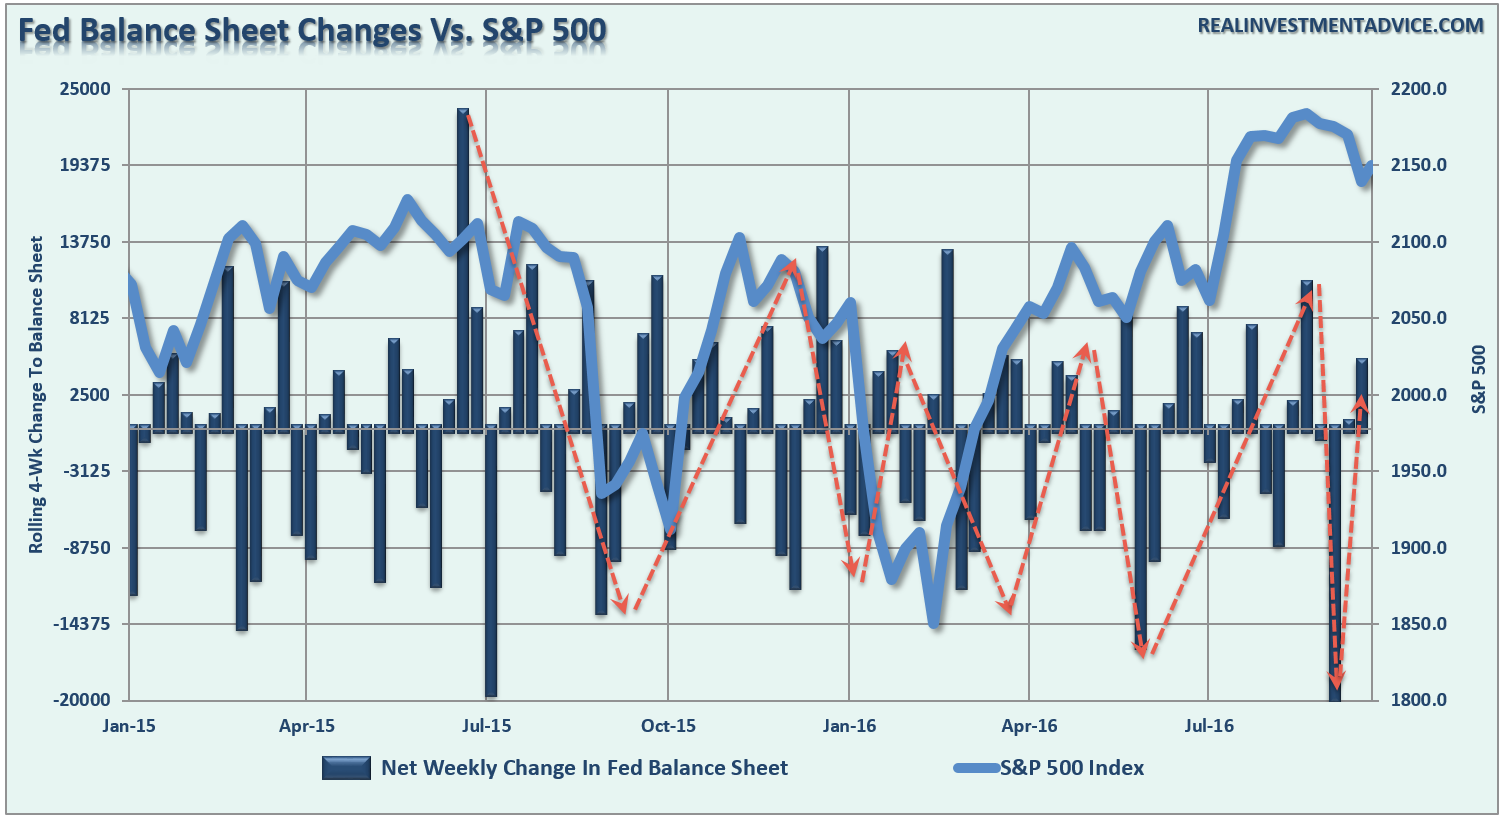
This caution is also due to the fact Federal Reserve liquidity will likely fade starting next week. As you will see in the chart below, the changes to the Fed balance sheet have a very steady rhythm. The spike last week, needed to keep the markets from breaking the bullish trend line, has temporarily been exhausted. Look for the markets to fade as liquidity dries up.
So, for now, we are exactly back to where we started from.
I will update this analysis in Tuesday’s “Technically Speaking” post at the website. Make sure you are registered at the site for e-delivery.
2-Types Of Inflation
I stated above that I would discuss the Fed’s inflation problem a bit more in depth. I have addressed the flaw in Yellen’s current monetary policy approach as a phenomenon known as a “liquidity trap” which is described as follows:
“A ‘Liquidity Trap’ is a situation described in Keynesian economics in which injections of cash into the private banking system by a central bank fail to lower interest rates and hence fail to stimulate economic growth. A liquidity trap is caused when people hoard cash because they expect an adverse event such as deflation, insufficient aggregate demand, or war. Signature characteristics of a liquidity trap are short-term interest rates that are near zero and fluctuations in the monetary base that fail to translate into fluctuations in general price levels.”
The problem for the Federal Reserve is that getting caught in a liquidity trap was not an unforeseen outcome of monetary policy, but rather an inevitable conclusion. As shown in the chart below the more active the Fed has become with monetary policy, the lower the eventual rates of GDP, inflation, and interest rates has become. As stated, the current low levels of inflation, interest rates, and economic growth are the result of more than 30-years of misguided monetary policies that have led to a continued misallocation of capital.
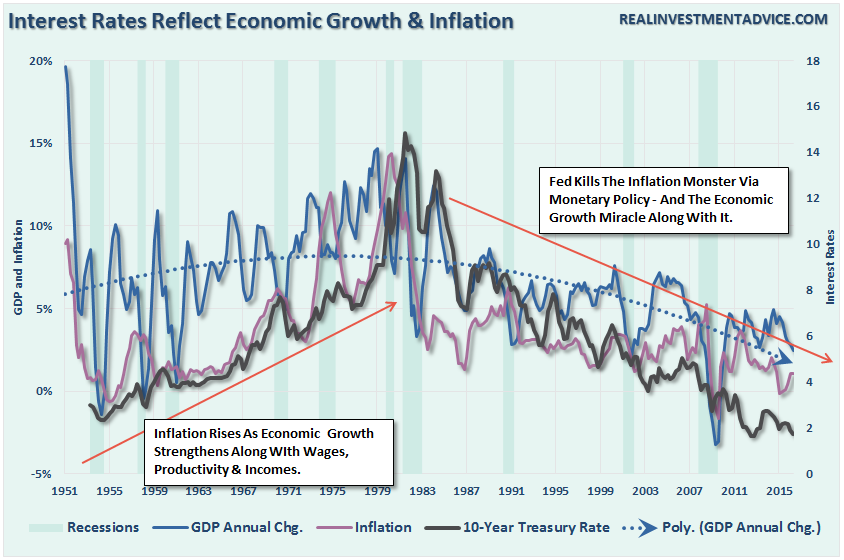
Importantly, notice in the chart above, that prior to 1980 inflation was indeed rising BUT so was economic growth AND interest rates.
During the 50’s, 60’s and 70’s, America was hard at working rebuilding Europe, Japan and the rest of the WWII destroyed landscape, entering the “space race” to put the first man on the moon, and fight the Korean and Vietnam wars. Increased manufacturing and production, rising wages and an expanding economy led to a demand for credit and pushed prices higher creating inflation. Even during the oil embargo, economic growth touched annualized rates of nearly 14%.
It was feared that high inflation and interest rates would create an economic catastrophe. So in the late 70’s, the Federal Reserve jumped into action to break the back of these pressures. Those actions, and the subsequent and ongoing monetary interventions by the Federal Reserve, led to the long slow decline of American prosperity.
Today, the Fed can only dream of the type of productivity growth, rising wage and economic pressures we once faced. Today, the lack of productive inflationary pressures (inflation caused by rising wages and increased economic activity that leads to higher prices) has been a construct of the underlying structural dynamics of the economy. Home ownership rates have plunged, technological advances and productivity increases have fostered wage suppression, and high levels of uncounted unemployed (54% of the 16-54 aged labor force) drag on economic strength. This is not to mention a massive group of aging “baby boomers” heading into retirement with little more than one-years worth of living expenses in the bank.
As I stated above, inflation driven by rising healthcare, insurance, and rent IS NOT THE SAME as inflation arising from rising wages, rising prices, and increased economic activity. The former acts as a cancer reducing levels of household liquidity and consumptive capacity.
The difference in inflation types was a point made by Dr. Ed Yardeni last week:
“Bob Wiley, the anxiety-prone obsessive-compulsive character played by Bill Murray in ‘What About Bob?,’ tells his psychiatrist, played by Richard Dreyfuss, ‘There are two types of people in this world: those who like Neil Diamond, and those who don’t.’
There are also two kinds of inflation. There’s the kind that stimulates demand by prompting consumers to buy goods and services before their prices move still higher. The other kind of inflation reduces the purchasing power of consumers when prices rise faster than wages. That variety of inflation certainly doesn’t augur well for consumer spending.
During the 1960s and 1970s, price inflation rose faster than interest rates. The Fed was behind the inflationary curve. So were the Bond Vigilantes. However, wages kept pace with prices because unions were more powerful than they are today, and labor contracts included cost-of-living adjustments. Back then, the University of Michigan Consumer Sentiment Survey tracked rising “buy-in-advance” attitudes. Those attitudes remained particularly strong in the housing market through the middle of the previous decade. On balance, inflation stimulated demand more than weighed on it. Borrowing was also stimulated.
Today, the major central banks would like to revive buy-in-advance attitudes, along with inflationary expectations, to boost demand for goods and services. For various reasons, the central bankers have failed to increase their inflation measures back up to their 2.0% targets. Despite several years of ultra-easy monetary policy since the financial crisis of 2008, the ECB’s preferred measure (i.e., the headline CPI) has been under 2.0% since February 2013, and was up only 0.2% y/y through August. The BOJ’s preferred inflation measure (i.e., “core” inflation excluding only food) has been under 2.0% since April 2015, and was 0.5% through July.
The variety of inflation that the US is experiencing isn’t the kind that stimulates economic growth. On the contrary, it has been led by rising rents, and more recently by rising health care costs. It is very unlikely that buy-in-advance attitudes cause people to rent today because rents will be higher tomorrow, or to rush to the hospital to get a triple-bypass today because it will be more expensive tomorrow! Higher shelter and health care costs are akin to tax increases because they reduce the purchasing power available for other goods and services. “
Bingo, Dr. Yardeni.
Importantly, while there have been, once again, the annual call for higher interest rates, the reality is the economic constructs to support higher interest rates simply does not exist. While interest rates and inflation may bounce up and down in the short-term, the long-term dynamics that are currently in play suggest that we, much like Japan, will continue to experience a long road of deflationary pressures and low interest rates.
Yellen Uses Code For Stock Market Bubble
Is the stock market overvalued? Yes!
S&P 500 median price to sales ratio 2.3 in record territory - #valuation matters while it may be ignored short term pic.twitter.com/F6puoiFYXx
— Babak (@TN) September 15, 2016
However, Ms. Yellen & Co. are not worried about such things. Or, are they?
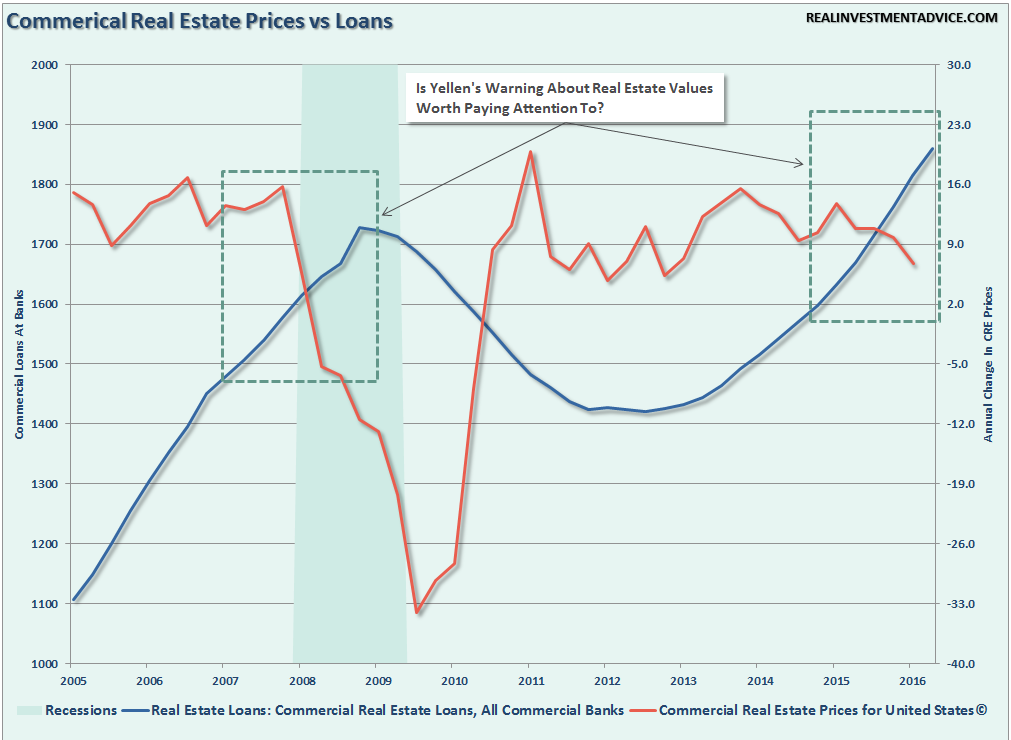
It was interesting that Janet Yellen mentioned “commercial real estate values” in her latest comments to the press. To wit:
“Yes. Of course, we are worried that bubbles will form in the economy and we routinely monitor asset valuations, while nobody can know for sure what type of valuation represents a bubble, that’s only something one can tell in hindsight, we are monitoring these measures of valuation and commercial real estate valuations are high. Rents have moved up over time, but still, valuations are high, relative to rents.”
DO NOT misunderstand the gravity in her statement. Commercial Real Estate (CRE) valuations are a direct function of the economic cycle. The tenants of CRE buildings are companies that are affected by the ebb and flow of the economy. The reason that valuations are high relative to rent is due to the fact we are at a peak of an economic cycle. CRE values FALL during an economic recession as tenants give back space and vacate buildings.
What Janet Yellen said, without saying it, is that stock market valuations are high as stock prices have been bid up by investors just as with CRE. When CRE valuations fall, so will asset prices. Markets, and by extension prices, do not exist in a vacuum. They are all ultimately tied to the business cycle.
For the moment, none of this matters. Global Central Banks continue to push liquidity and suppress interest rates forcing investors to shove precious capital in the markets for the coordinated and ongoing “chase for yield.”
However, it is worth repeating that nothing last forever, but it can, and often does, last longer than you can imagine.
Unfortunately, so does the reversion to the mean.
THE MONDAY MORNING CALL
The Monday Morning Call – Analysis For Active Traders
Sector By Sector
Let’s take a quick look at the 9-major sectors of the S&P 500 to determine the overall strength of the bullish bias.
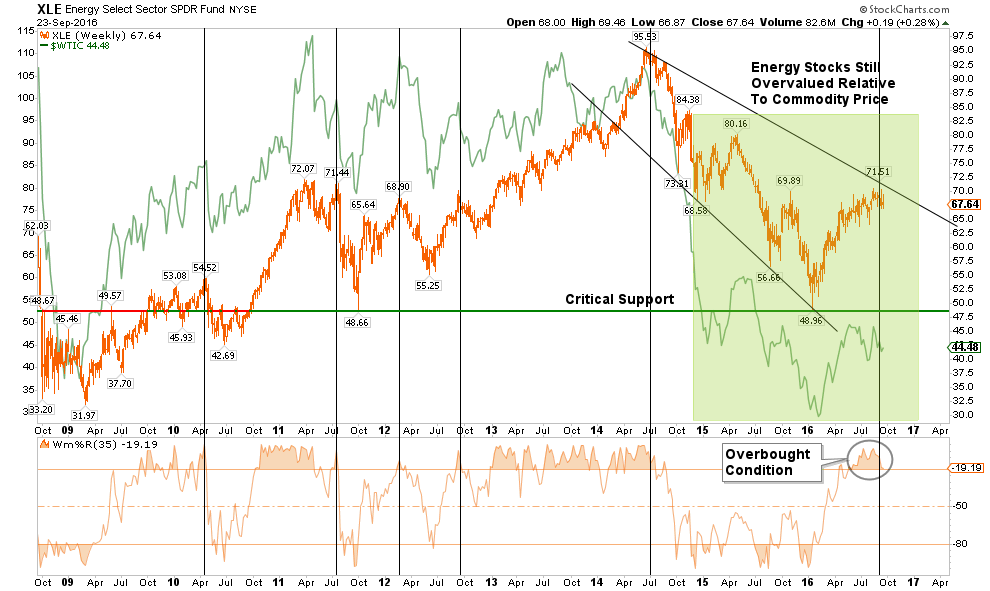
ENERGY
The energy sector is closely tied to the underlying commodity price. Given the ongoing structural dynamics of the commodity, there is still an unrealized detachment between energy sector fundamentals and the markets. There is still more correction to occur in this sector so underweight energy exposure is advised for now.
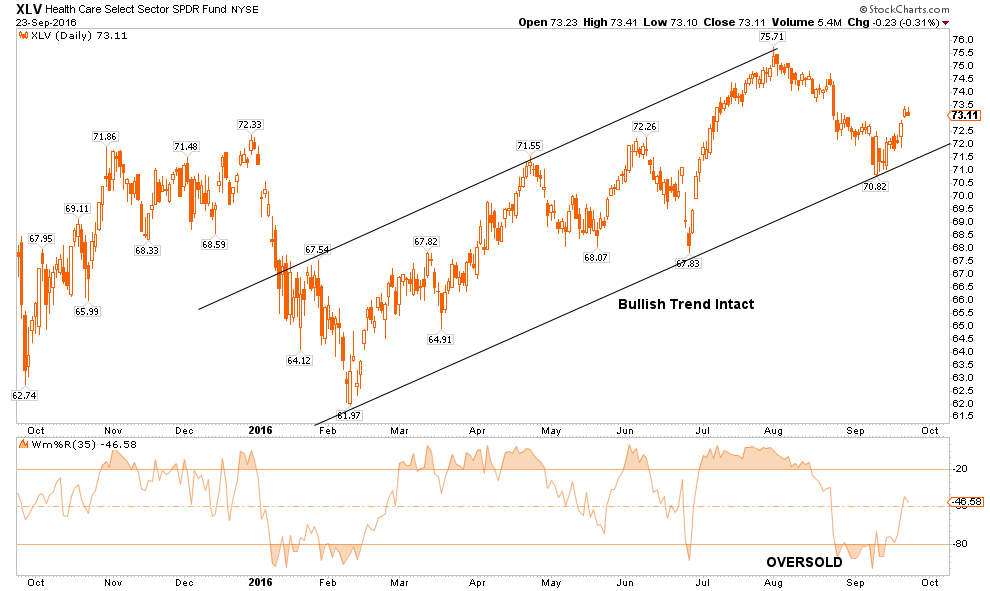
HEALTH CARE
The healthcare sector has been a laggard as of late and is currently recovering from an oversold condition. With the bullish trend line still intact, I would expect this sector to outperform the broader market over the next week as money continues a rotation from “risk” towards “less risk.”
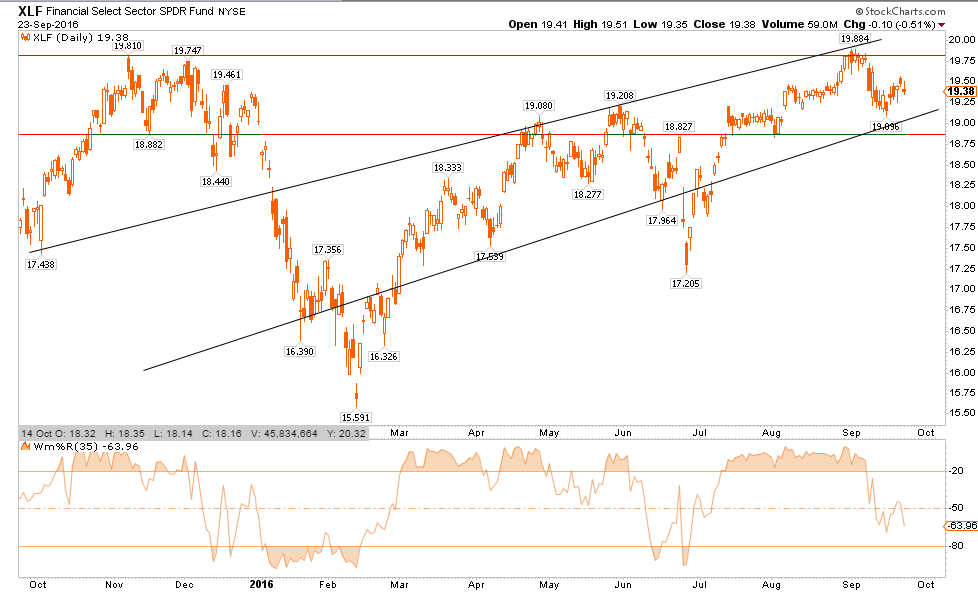
FINANCIALS
Financials continue to be a laggard and with the fundamental problems in the sector, and with major banks, the relative “risk” of ownership continues to outweigh the potential rewards for now. I continue to recommend an underweighting of the sector in portfolios for now.
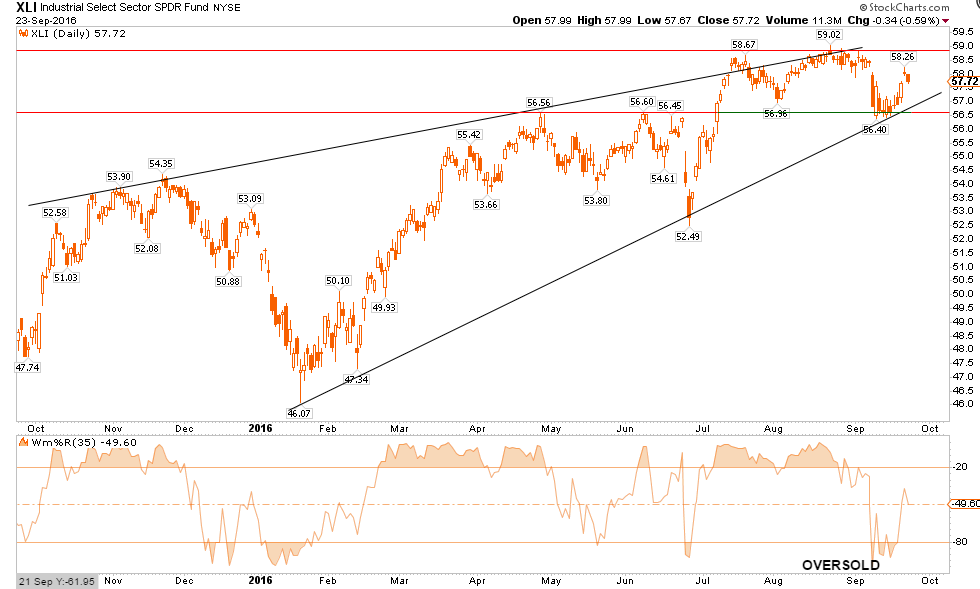
INDUSTRIALS
Industrial stocks, because of the dividend yield, continue to remain overweight in portfolios for now. However, this sector is directly affected by the broader economic cycle and with expectations ahead of fundamental realities, risk is high. No more than a normal weight position in portfolios is advised for now with stops set just below the bullish trend line.
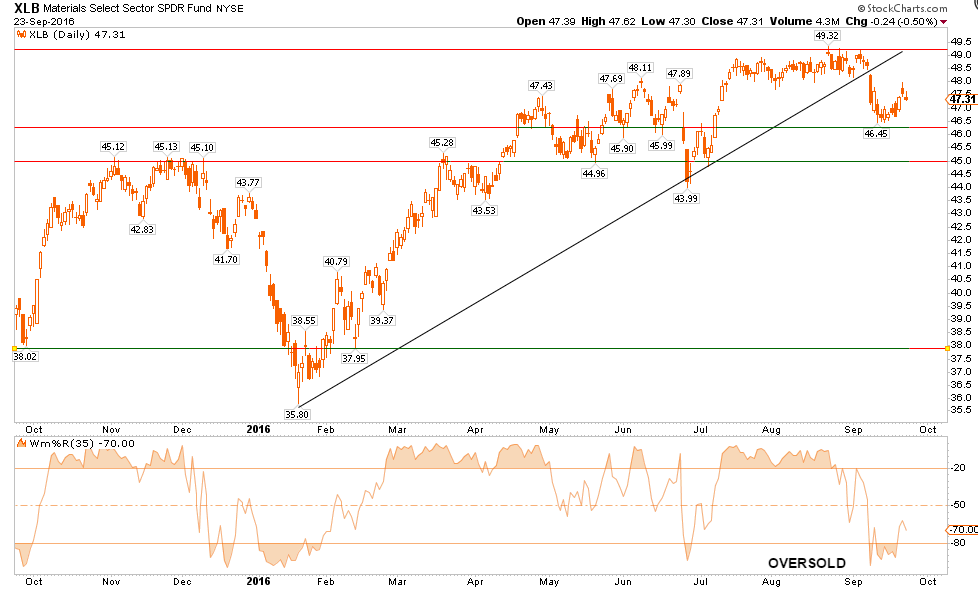
MATERIALS
Basic Materials, also a beneficiary of the dividend chase, have broken their bullish trend line. This takes the sector to an underweight holding for now with stops set at the lower support lines $45.00.
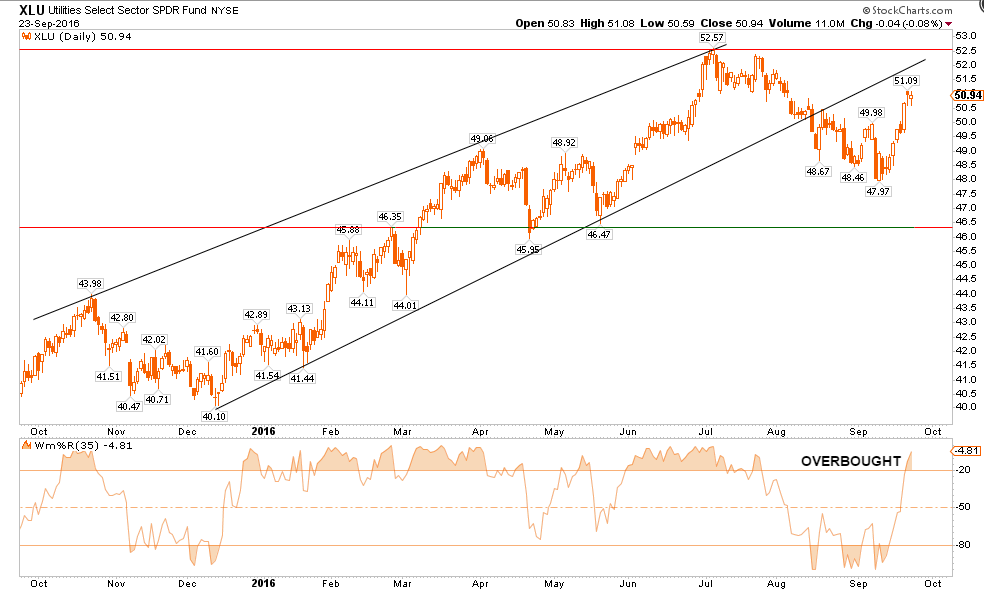
UTILITIES
As I suggested last week, Utilities have had a strong advance this week as money rotated back into “safety” plays of bonds and interest rate sensitive sectors. However, like the Materials sector, the bullish trend line has been broken so caution is advised. Stops should be set on current holdings at $46.5.
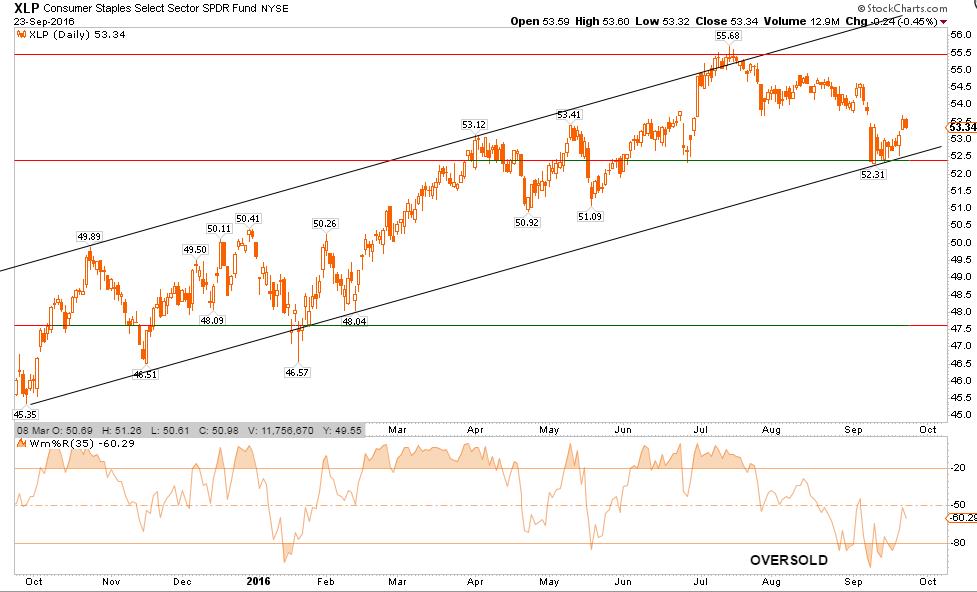
STAPLES
Staples, another beneficiary of the yield and safety chase, held support at the bullish trend line and is currently oversold. Weightings to this sector can be increased for now with a target at the upper resistance levels of old highs.
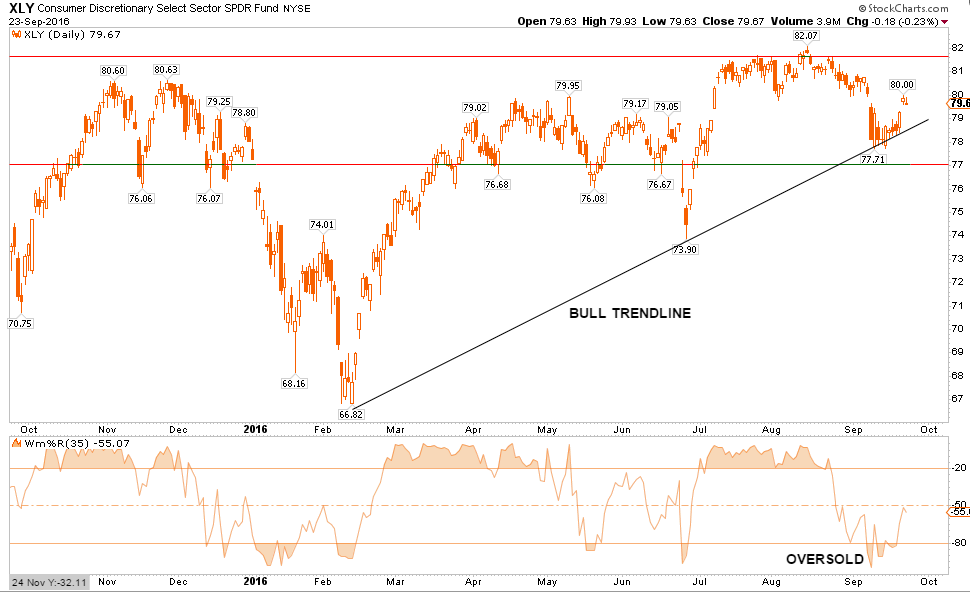
DISCRETIONARY
As goes Staples, so goes Discretionary. Same advice as well. Portfolio weightings can be increased for now to Discretionary holdings with a target of previous highs. Stops should be set at the bullish trend line support.
TECHNOLOGY
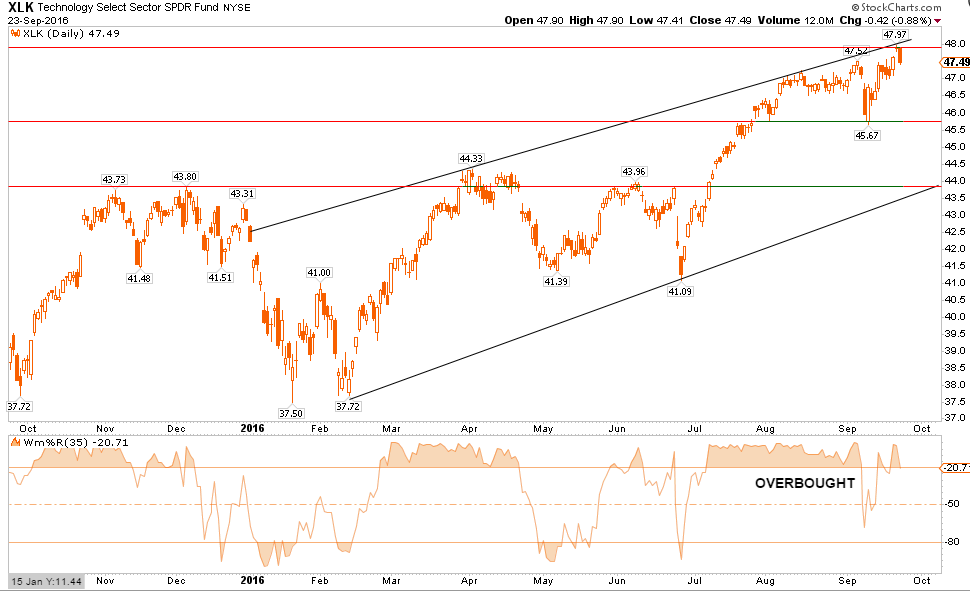
The Technology sector has been the “obfuscatory” sector over the past couple of weeks. Due to the large weightings of Apple, Google, Facebook, and Amazon, the sector kept the S&P index from turning in a worse performance than should have been expected. Apple’s surge alone last week accounted for roughly half of the performance of the index alone. The sector is overbought but in a strong trend. Weighting should be at normal portfolio weight for now with a stop at the recent lows.
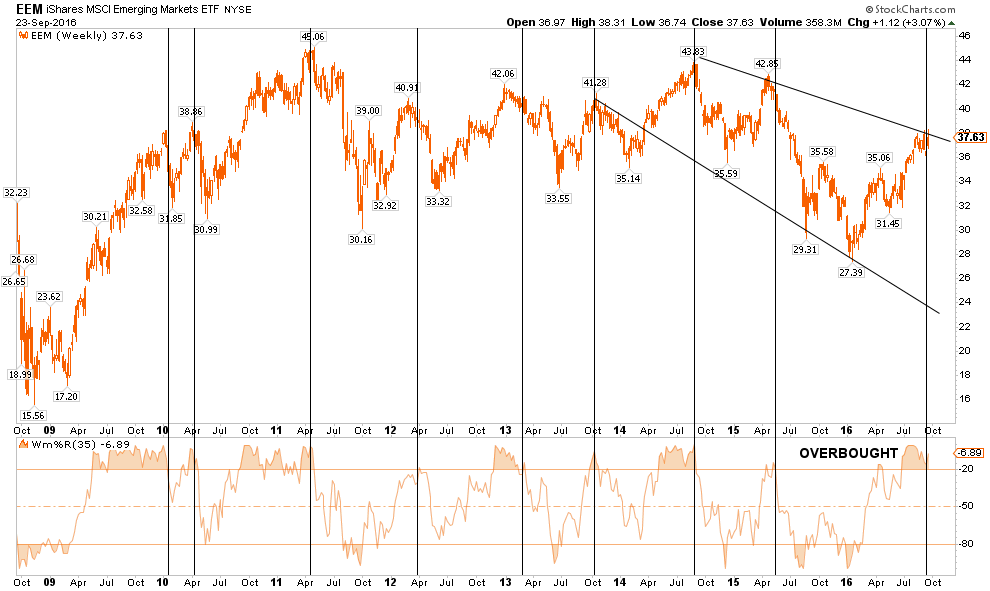
EMERGING MARKETS
Emerging markets have had a very strong performance during the summer but remain in a very defined downtrend. With the sector once again at very overbought levels, profits should be harvested and the sector under-weighted in portfolios. Long-term underperformance of the sector relative to domestic stocks continues to keep emerging markets unfavored in allocation models for now.
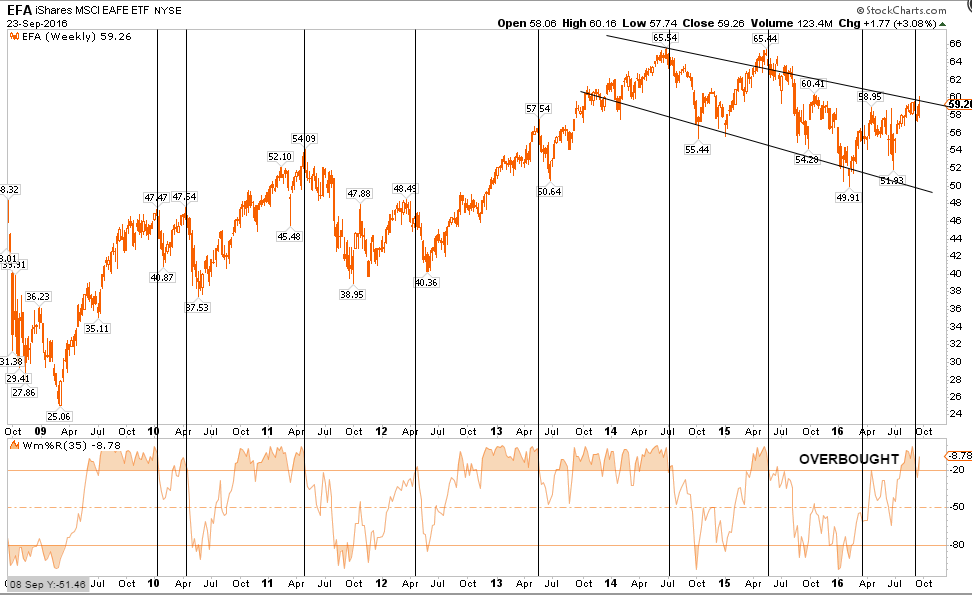
INTERNATIONAL MARKETS
As with Emerging Markets, International sectors also remain unfavored in allocation models. The long-term downtrend remains intact and is currently very overbought. Underweight the sector for now, take profits, and focus more on domestic sectors for now.
DOMESTIC MARKETS
The S&P 500 had a good run last week as the Fed remained on the sidelines once again. However, with the markets back to overbought, and failing to hold its respective 50-dma, the corrective process is likely not over as of yet. Caution still advised for now.
Still Buying Bonds
Two weeks ago, I discussed what I believe to be the premature calls for the death of the“bond bull market.” As I wrote:
“Given that interest rates had gotten extremely oversold during the ‘Brexit,’ as money poured into bonds for safety, it is not surprising to see rates have a reflexive move higher. What we saw on Friday was likely rate “shorts” being blown out of positions.”
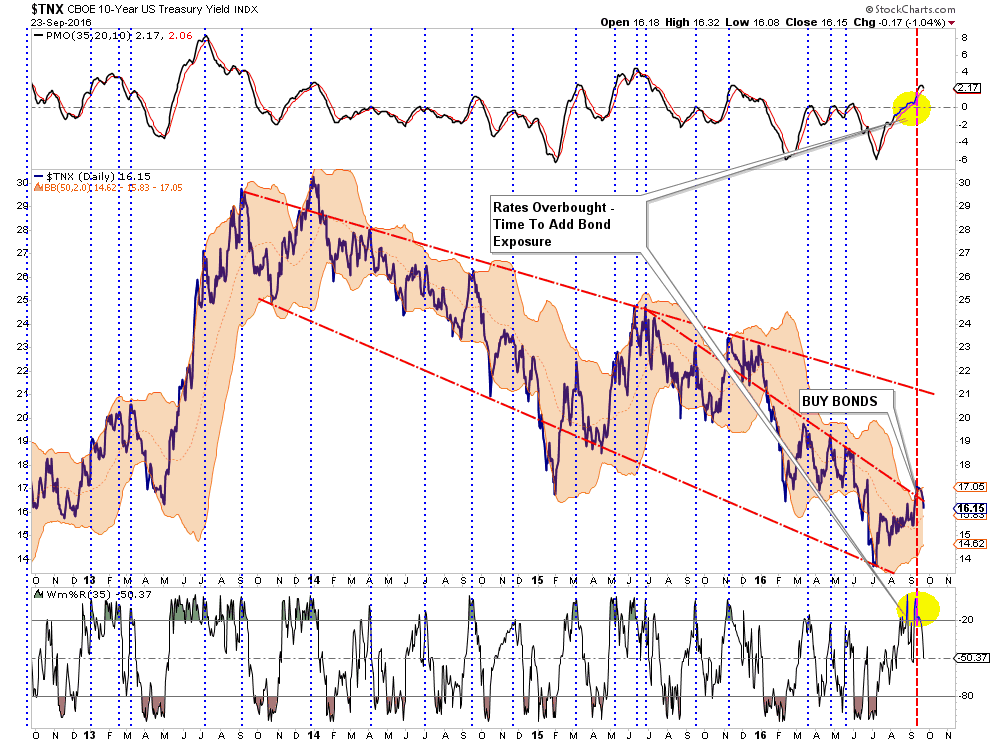
“Importantly, while interest rates could possibly tick higher to the long-term downtrend line at 2.1%, (OMG, run for the hills), the reality is the economy is not growing strongly enough to support substantially higher rates which will push the economy more quickly towards the next recession.
Of course, during recessions interest rates fall sharply which is why I still suspect, given the majority of global economies in negative territory, them to ultimately approach zero.“
With economic data still pointing to a weaker economic environment ahead, I am still buying bonds.
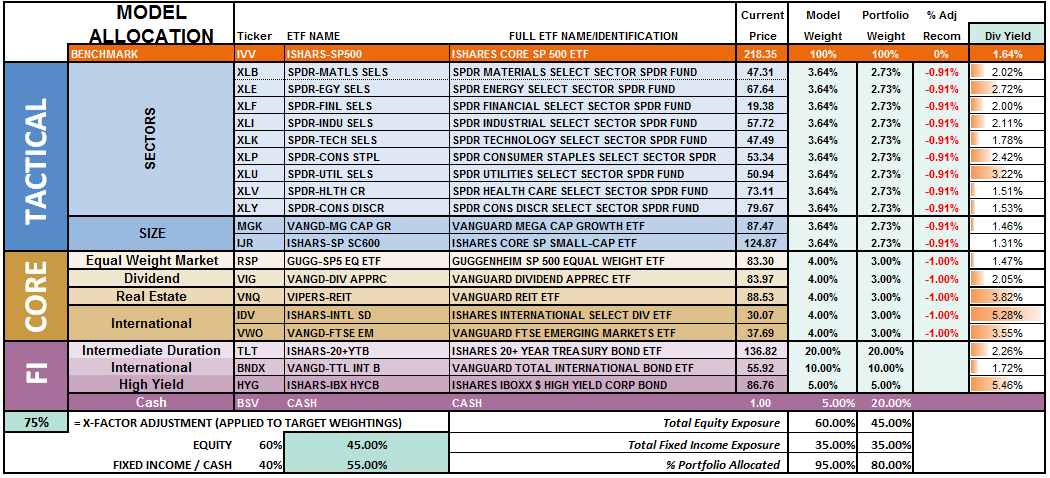
Model Update
S.A.R.M. Sector Analysis & Weighting
As I said last week:
“The question now – is it over yet? The internal damage to the market was substantially greater than the headline index would suggest, so some caution is advised heading into next week. However, we have been looking for an opportunity to increase equity exposure in portfolios and we may get that opportunity soon. We will patiently wait and let the market “tell us” what to do next rather than“guessing” at it. “
While the advance was good, it failed to clear the 50-dma and remains below significant overhead resistance. While actual portfolio equity risk weightings remain below our target of 75% again this week, the odds of a further correction next week keeps us on hold for now until we find a short-term bottom and can redetermine risk/reward ratios. I have loaded positions in the trading system to be allocated if the markets continue to strengthen next week.
(Note: This is an equally weighted model example and may differ from discussions of overweighting/underweighting specific sectors or holdings.)
Relative performance of each sector of the model as compared to the S&P 500 is shown below. The table compares each position in the model relative to the benchmark over a 1, 4, 12, 24 and 52-week basis.
Historically speaking, sectors that are leading the markets higher continue to do so in the short-term and vice-versa. The relative improvement or weakness of each sector relative to index over time can show where money is flowing into and out of. Normally, these performance changes signal a change that last several weeks.
As I noted last week as well:
“The recent spike in interest rates has now reached the top of the long-term downtrend and suggests that staples, utilities, and bonds will improve in performance over the next couple of weeks. Such improvement will most likely coincide with an ongoing market consolidation or correction.”
That advice worked out well this past week and remains this week as well.
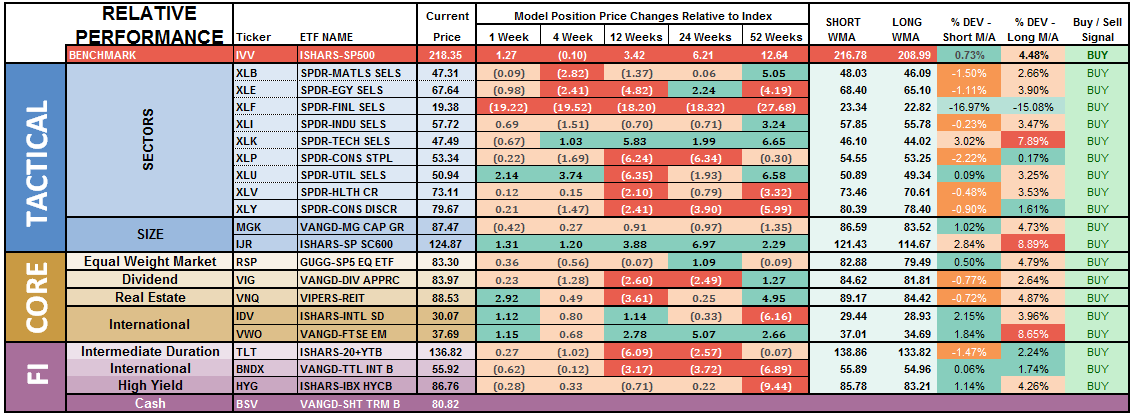
Notice in the next to last column to the right, the majority of sectors which have previously been pushing extreme levels of deviation from their long-term moving average, have corrected much of those extremes.
Basic Materials, Staples, Utilities, REIT’s and Bonds are currently at the biggest deviations below their short-term moving average. Historically speaking, and as noted above, such deviations would suggest these sectors deserve some attention in portfolios as this is where buying opportunities TEND to exist. It also supports the comment above that a further consolidation or correction in the markets is likely as these more defensive sectors tend to benefit from the rotation from “risk” to “safety.”
Importantly, if the current pullback is a “buy the dip” opportunity, the sectors that maintain their technical underpinnings and resolve the extreme deviations from short and long-term moving averages will provide good opportunities to add to portfolios.
The two charts below graphically show the relationship of each position’s performance relative to the S&P 500 Index. If we are trying to “beat the index” over time, we want to overweight sectors/asset classes that are either improving in performance or outperforming the index, and underweight or exclude everything else.
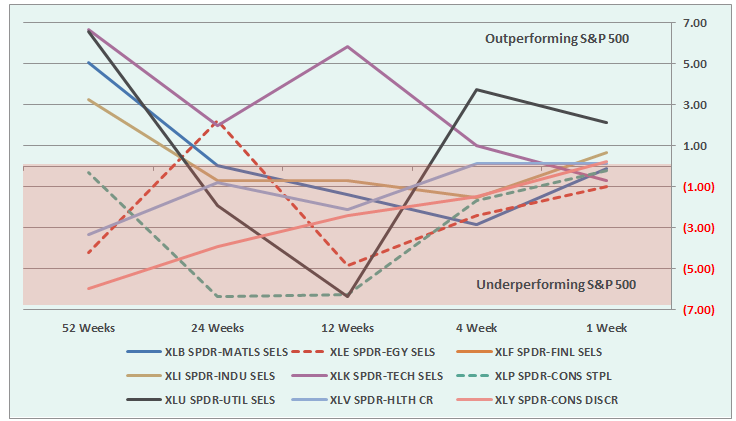
Sectors Currently Outperforming by >1%
- Utilities (improving)
Sectors Currently Performing In Line <>1%
- Healthcare
- Staples
- Discretionary (improving)
- Energy
- Materials (improving)
- Industrials (improving)
Sectors Currently Under Performing By >1%
- Financials (weakening – $WFC related, could spread to other majors.)
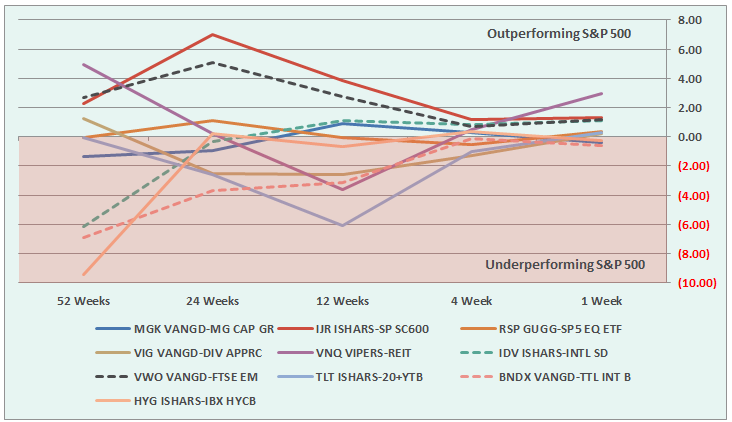
Index/Other Asset Classes Out Performing S&P 500 By >1%
- REIT’s (improving)
- International (improving, but extreme overbought)
- Emerging Markets (improving, but extreme overbought)
- Small Caps (improving)
Index/Other Asset Classes Performing In-Line With S&P 500 <>1%
- Equal-Weight S&P 500 (improving)
- Dividend Stocks (improving)
- International Bonds
- High Yield Bonds
- Domestic Bonds (improving)
- Mid-Cap Stocks (weakening)
Index/Other Asset Classes Under Performing S&P 500 By >1%
- None
The risk-adjusted equally weighted model has been increased to 75%. However, as stated above, further consolidation in the markets is needed before making any changes.
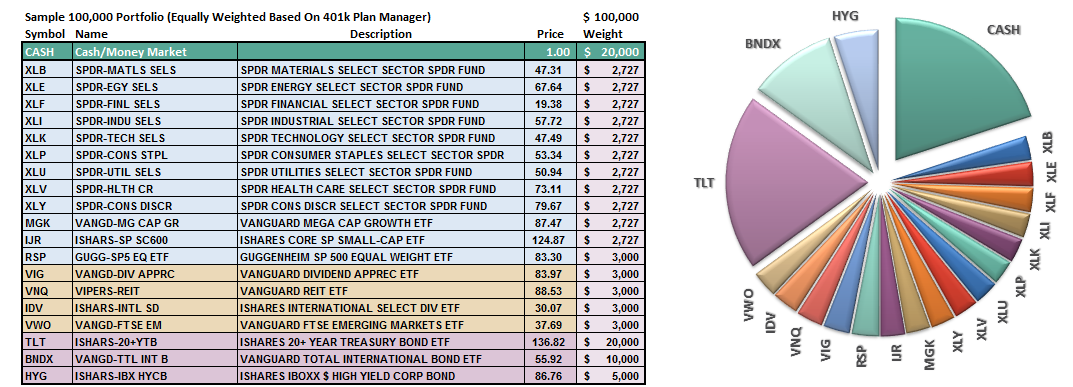
Such an increase will change model allocations to:
- 20% Cash
- 35% Bonds
- 45% in Equities.
As always, this is just a guide, not a recommendation. It is completely OKAY if your current allocation to cash is different based on your personal risk tolerance, time frames, and goals.
For longer-term investors, we still need to see improvement in the fundamental and economic backdrop to support the resumption of a long-term bullish trend.Currently, there is no evidence of that occurring.
THE REAL 401k PLAN MANAGER
The Real 401k Plan Manager – A Conservative Strategy For Long-Term Investors
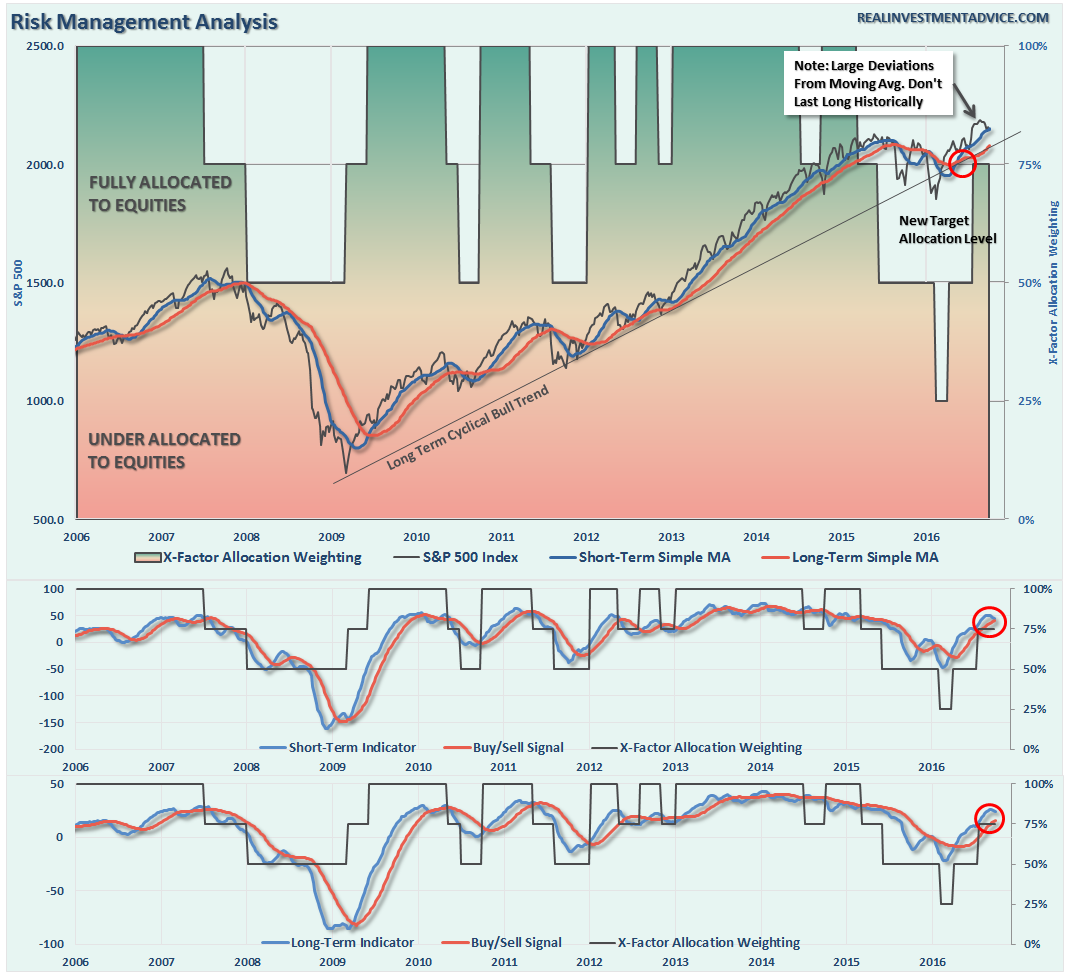
NOTE: I have redesigned the 401k plan manager to accurately reflect the changes in the allocation model over time. I have overlaid the actual model changes on top of the indicators to reflect the timing of the changes relative to the signals.
There are 4-steps to allocation changes based on 25% reduction increments. As noted in the chart above a 100% allocation level is equal to 60% stocks. I never advocate being 100% out of the market as it is far too difficult to reverse course when the market changes from a negative to a positive trend. Emotions keep us from taking the correct action.

Round-Trippin’
This past week the markets bounced sharply off of the bullish trend support line as Yellen & Co. promised to not remove the punch bowl now until Christmas. What a “Grinch.”
However, with that, we round-tripped right back to where we started from.
So, is the correction over? Not sure just yet.
Early warning signals are suggesting the correction has more room to go, so let’s be patient this coming week. By this time, next week, we will likely have a fairly good indication as to what the market wants to do.
Over the past several weeks, I have continued to suggest reviewing portfolios, reducing risk, rebalancing and preparing for “whatever comes next.” That advice has paid off by reducing volatility in portfolios. If you haven’t done anything yet, I would continue to suggest using this bounce, as I predicted last week, to take some action to clean up allocations by:
- Tightening up stop-loss levels to current support levels for each position.
- Taking profits in positions that have been big winners
- Sell laggards and losers
- Raise cash and rebalance portfolios to target weightings.
With the election right around the corner, increased volatility is expected. Therefore, having a little extra cash in portfolios will likely be a good hedge.
If you need help after reading the alert; don’t hesitate to contact me.
Current 401-k Allocation Model
The 401k plan allocation plan below follows the K.I.S.S. principal. By keeping the allocation extremely simplified it allows for better control of the allocation and a closer tracking to the benchmark objective over time. (If you want to make it more complicated you can, however, statistics show that simply adding more funds does not increase performance to any great degree.)

401k Choice Matching List
The list below shows sample 401k plan funds for each major category. In reality, the majority of funds all track their indices fairly closely. Therefore, if you don’t see your exact fund listed, look for a fund that is similar in nature.

Disclosure: The information contained in this article should not be construed as financial or investment advice on any subject matter. Streettalk Advisors, LLC expressly disclaims all liability in ...
more


Thanks for sharing