Amazon Update
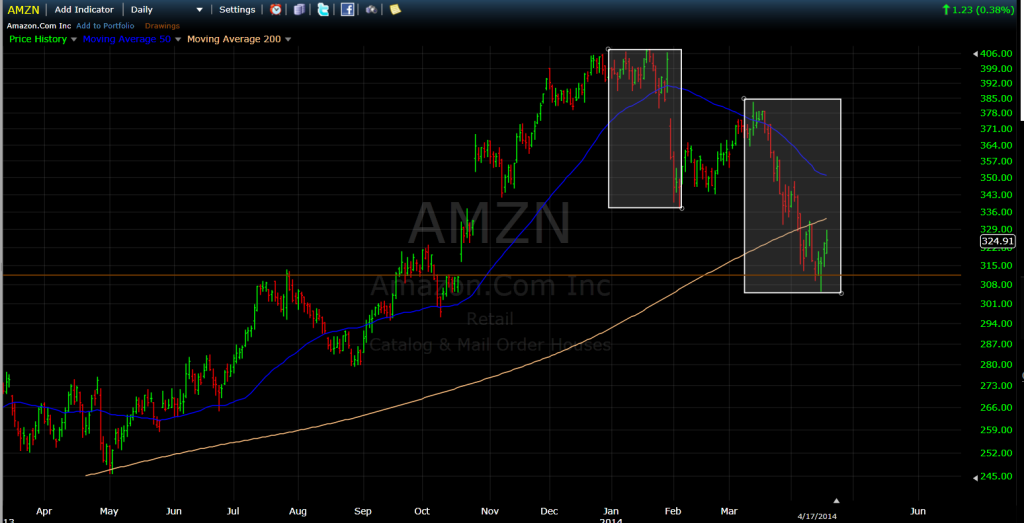
Amazon (AMZN) looks to have found at least some short term support near the zone that we pointed out in a prior post. The stock price seems to have completed an A-B-C correction pattern as it experienced two separate but similar sized drops of about $70 points (shaded rectangles), with one $46 point retrace rally in between.
Now it’s anyone’s guess what the stock price will do going forward, and it does have some technical headwinds to overcome. But the support zone did seem to be a good area to do business in if you were bullish on the name in the first place.
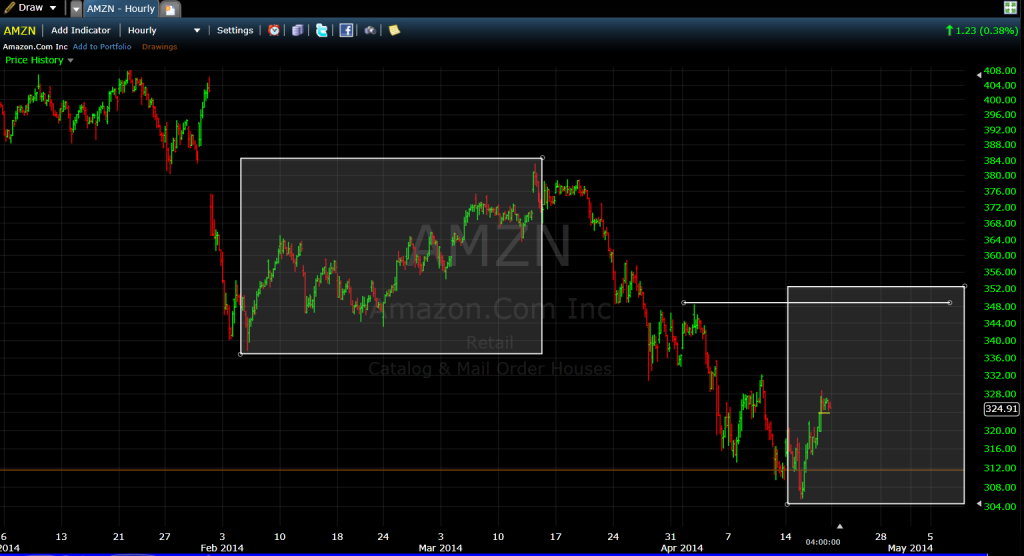
Now we mentioned the technical headwinds above, this 60 minute chart above details what may be an important confluence area. In this chart we have highlighted the last retracement rally in the stock price, which came in at roughly $46 points. If we add that to the last swing low created this week, it projects to around $352. There happens to be a prior swing high at $348, the 50 day moving average and the midpoint of this last drop, all in the vicinity as potential confluence. May be something to watch going forward.
None.


