
Above The Forty – The S&P 500 Bids To End Bearish Divergence
(“Above the 40” uses the percentage of stocks trading above their respective 40-day moving averages [DMAs] to assess the technical health of the stock market and to identify extremes in market sentiment that are likely to reverse. Abbreviated as AT40, Above the 40 is an alternative label for “T2108” which was created by Worden. Learn more about T2108 on my T2108 Resource Page. AT200, or T2107, measures the percentage of stocks trading above their respective 200DMAs.)
AT40 (T2108) Status: 60.3%
AT200 (T2107) Status: 68.4%
VIX Status: 11.0
Short-term Trading Call: neutral
Nothing says “strong sentiment” like a stock market that actually rallies on a strong U.S. jobs report: the fear of the implications for hawkish monetary policy has seemingly disappeared. The S&P 500 (SPY) jumped 0.7% in the wake of the report on January jobs. The index closed within a point of its all-time high. The NASDAQ (QQQ) pushed to a new all-time high by 6 points.
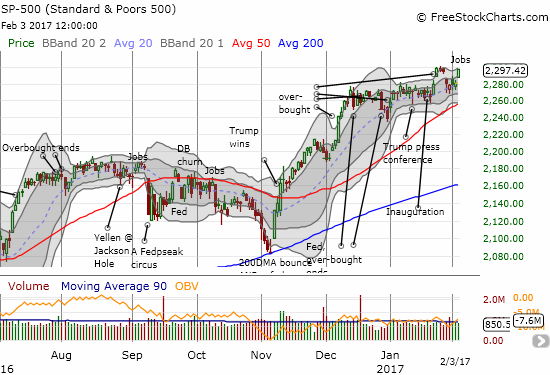
The S&P 500 moves within “inches” of invalidating its 3-day abandoned baby top.
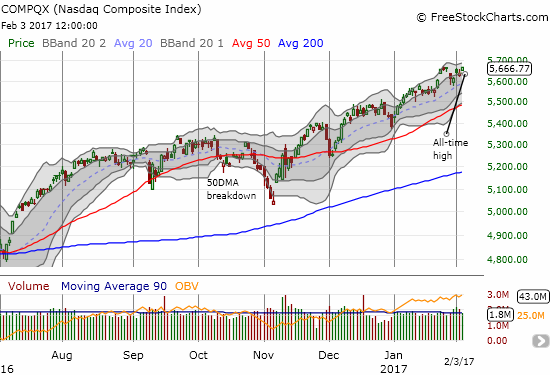
The NASDAQ closed at a new all-time high
The current rally has been one of the more stealthy (and halting) ones in a long time.
After the NASDAQ bounced off its pre-election low on November 4th, it made a statement after December 1 when it bounced off support at its 50-day moving average (DMA) with a 20DMA newly trending upward. The S&P 500 on the other hand came to a screeching halt after its December high on the 13th. Its breakout on January 25th should have heralded a confirmation of a new bullish turn but instead the index came to another complete halt. THAT pause turned toppy when the index gapped down and formed a 3-day abandoned baby top. Amazingly, the S&P 500 failed to close cleanly below my line in the sand at 2,280 marking off bearish territory. Now, the index has come back to attempt an invalidation of the bearish topping pattern.
My short-term trading call stays at neutral despite the bullish prospects. The bearish divergence between the S&P 500 and AT40 remained in place despite AT40’s hop from 53.3% to 60.3%. AT40 closed just below a downtrending 20DMA; only a move back into overbought territory will end the bearish divergence. Moreover, as I have stated in earlier posts, I will not flip the trading call to bullish on a fresh breakout simply because the volatility index, the VIX, is so dangerously low.
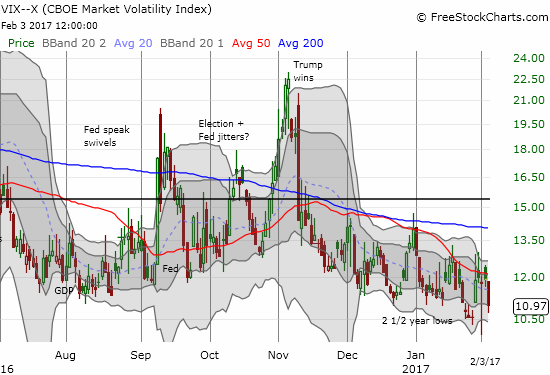
The volatility index, the VIX, plunged 8.1% to return to 2 1/2 year lows
The bounce in the VIX on January 30th when the S&P 500 gapped down made sense because the VIX historically has spent little time plumbing these depths. Yet, the bears and sellers continue to prove incapable of sealing the deal. This trading situation is sub-optimal as I would prefer to be definitive about the trading call when there are so many individual stocks making definitive (up AND down) moves. But it is what it is.
My overall strategy is to keep bullish trades tightly focused on my preferred sectors of commodities, homebuilders, and cybersecurity and be open to one-off cases. This approach allows me to avoid regret since these are areas I like over longer periods of time and have no problem accumulating (conditionally) on sell-offs. Outside of that, I am looking for reasons to short. Again, not ideal, but this is what happens with a neutral short-term trading posture.
ETF Managers Trust – PureFunds ISE Cyber Security ETF (HACK) is up 6.8% since I responded to IBD’s contest. Unfortunately, this performance lags the NASDAQ’s 8.7% since then. In the last week, HACK finally broke out to a new 17-month high.
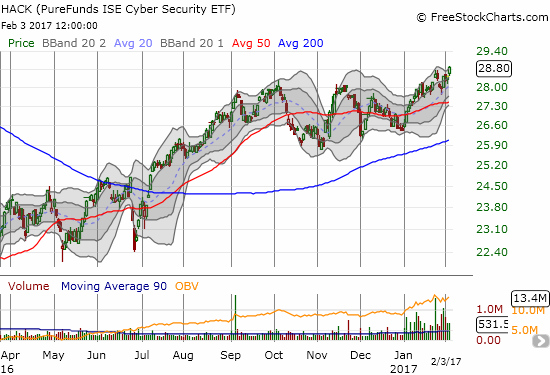
ETF Managers Trust – PureFunds ISE Cyber Security ETF has experienced a surge of trading volume in 2017. Buyers have finally propelled HACK into a breakout.
In December, I offered up cybersecurity firm Rapid7, Inc. (RPD) as a potential beneficiary of a January relief rally. At the time, RPD was rocketing higher and the next day succeeded in reversing its post-earnings loss. RPD has not traded higher since and my position is just above flat right now. I still like RPD as an under-valued cybersecurity play and plan to keep holding just like HACK.
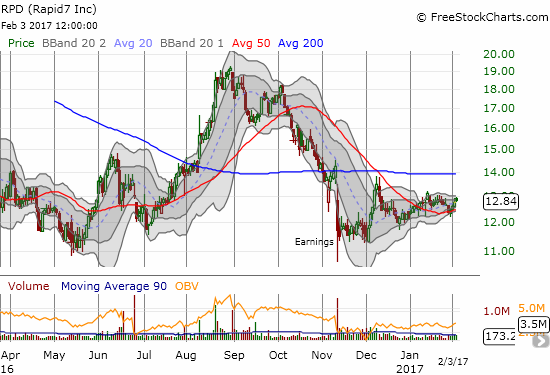
After reversing its last post-earnings loss, Rapid 7 (RPD) has struggled to maintain the momentum.
Amazon.com (AMZN) dropped 3.5% in response to its latest earnings report. I went back into the strategy archives and bought the dip for a two-week play. This time around I picked a bullish call spread (820/830). In the chart below, I drew a dark line across all-time highs to highlight AMZN’s next technical challenge: breaking out above a double-top.
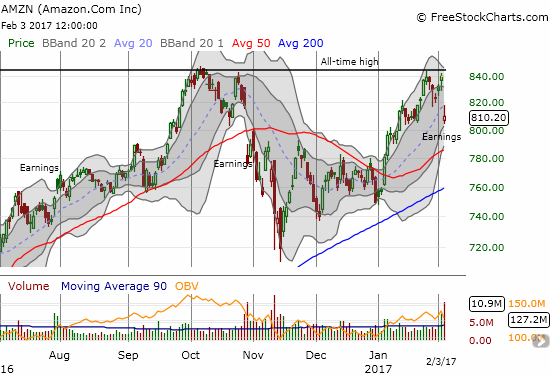
Amazon.com gaps down below its primary uptrend at its 20DMA. This loss confirms a double-top but support from 50 and 200DMAs are rushing upward.
Facebook (FB) is working on its own double-top pattern at all-time highs. The post-earnings reaction created a bearish fade from an intraday all-time high. Buyers stepped back in on Friday only to get turned back again. A retest of the 20DMA uptrend is in play, and I can easily see FB retesting its 50 and 200DMAs in coming weeks.
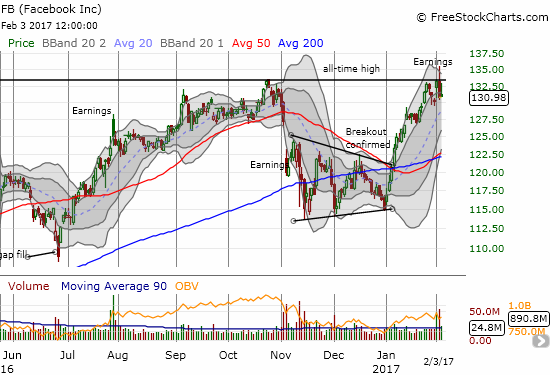
Facebook (FB) suffered a bearish post-earnings fade right at all-time highs.
As a reminder, a breakout from a double-top is a VERY bullish event. So I am on alert for both AMZN and FB either way the winds blow.
After China hiked interest rates by the smallest of fractions on Friday, commodities responded in kind by selling off. China is churning through an on-going cycle of heating and cooling its economy that can catch traders and investors off-guard. I now have to cool my own jets and watch what develops. My short-term trade on Freeport-McMoran (FCX) is likely over as FCX once again reversed its post-earnings gain. My trade on the 50DMA for Cliffs natural Resources (CLF) still has a chance with the 50DMA looming directly overhead as a pivot.
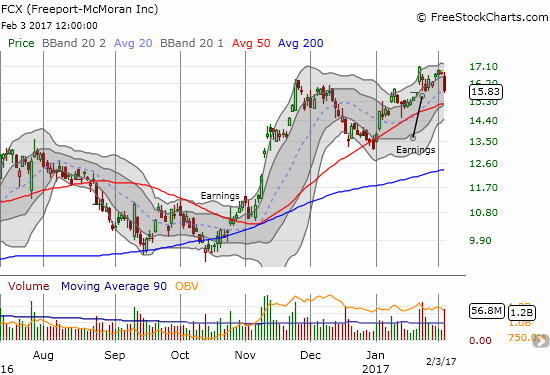
Freeport-McMoran tumbled 5.8% in the wake of China’s rate hike.
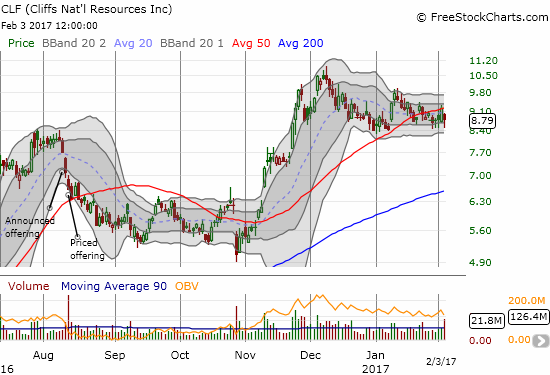
Cliffs Natural Resources (CLF) fell 4.5%. A bounce of its intra-day low kept it within the consolidation range.
I am now bearish on Caterpillar (CAT) which is heavily dependent on commodities and China. Per my note February 1st, a close below its 50DMA is a shorting signal. A close below $91.50 will be an aggressively bearish signal. I am going to wait for the latter before acting unless I feel my bullish positions have gotten big enough to motivate me to look for a hedge.
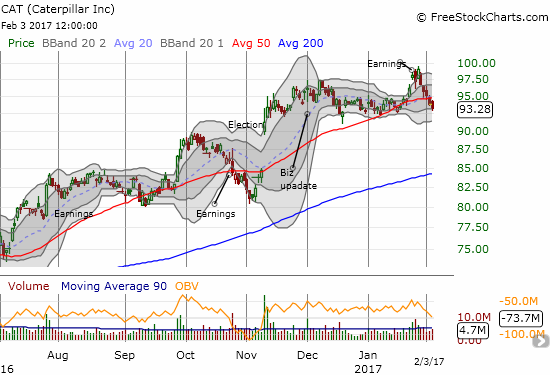
Caterpillar is in freshly bearish territory with a test of the last trading range coming up.
Chipotle Mexican Grill (CMG) is back in focus after one of the nastier post-earnings fades that can happen. CMG gapped up only to sell off right from the open. After the smoke cleared, CMG lost 4.5%, cracked 200DMA support, printed a bearish engulfing pattern, and confirmed a second failure at what is now resistance at the “Ackman” ceiling.
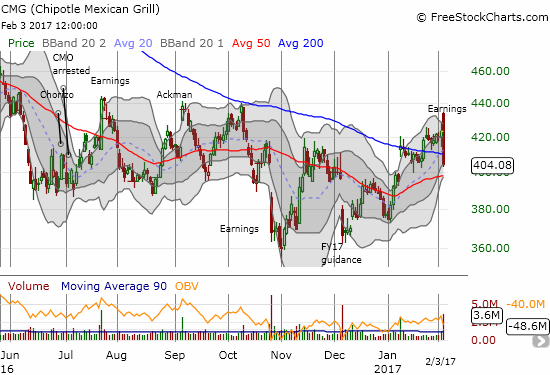
Chipotle Mexican Grill (CMG) failed once again to break through the high printed by the Ackman gap up in early September.
Finally, financial stocks responded exceptionally well to news of President Trump’s executive order to begin dismantling the Dodd-Frank regulation of the financial industry. The Financial Select Sector SPDR Fund (XLF) jumped 2.0% and stopped just short of a fresh 9-year high. XLF added juice to the S&P 500’s post-jobs rally. The news also catapulted Goldman Sachs (GS) out of a bearish breakdown and its highest post-earnings close.
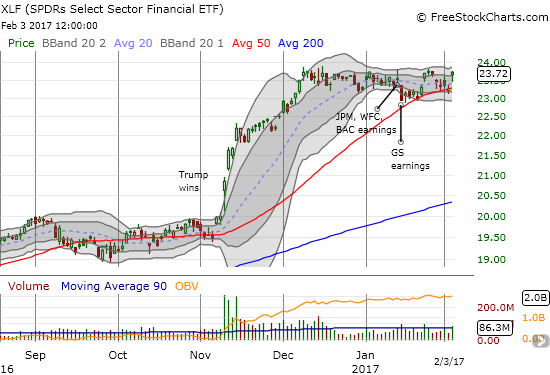
The Financial Select Sector SPDR Fund (XLF) returned to the edge of a freshly bullish breakout. Is this time for real?
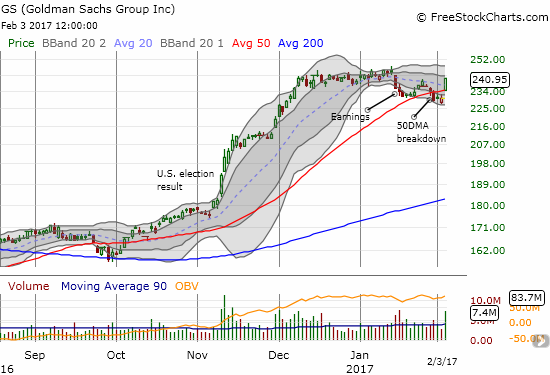
Goldman Sachs (GS) escaped a bearish breakdown in a flash with a gap up above 50DMA resistance and a 4.6% gain.
Active AT40 (T2108) periods: Day #241 over 20%, Day #61 over 30%, Day #60 over 40%, Day #58 over 50%, Day #1 over 60% (overperiod, ending 4-day underperiod), Day #7 under 70%
Daily AT40 (T2108) vs the S&P 500

Black line: AT40 (T2108) (measured on the right); Green line: S&P 500 (for comparative purposes)
Red line: AT40 (T2108) Overbought (70%); Blue line: AT40 (T2108) Oversold (20%)
Weekly AT40 (T2108)

All charts created using freestockcharts.com unless otherwise stated
The charts above are my LATEST updates independent of the date of this given AT40 post. For my latest AT40 post click here.
Full disclosure: long AMZN call spread, long XLF call options, long FCX and CLF call ...
more

