
Above The 40 – S&P 500 Follow-Through Finally Ends Bearish Divergence
AT40 Status: 66.4% of stocks are trading above their respective 40-day moving averages (DMAs)
AT200 Status: 69.9% of stocks are trading above their respective 200DMAs
VIX Status: 11.1 (volatility index)
Short-term Trading Call: neutral
Commentary
For the first time since December, the S&P 500 (SPY) has displayed strong follow-through to a break out to fresh all-time highs.
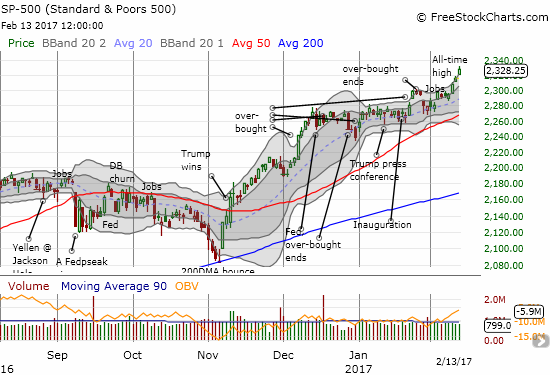
The S&P 500 is ramping along its outermost upper-Bollinger Band.
Buyers have been strong enough to hit the upper-Bollinger Band (BB) three days in a row. Indeed, the BB is opening up to a near parabolic move on the index. I am on watch now for a climactic buying frenzy.
AT40 (T2108), the percentage of stocks trading above their respective 40-day moving averages (DMAs), traded as high as 68.0% but settled for a more marginal gain at 66.4%. AT40 has finally broken through the downtrend that kept it in a bearish divergence from the S&P 500 (SPY), but the tentativeness at the overbought boundary (70%) prevented confirmation.
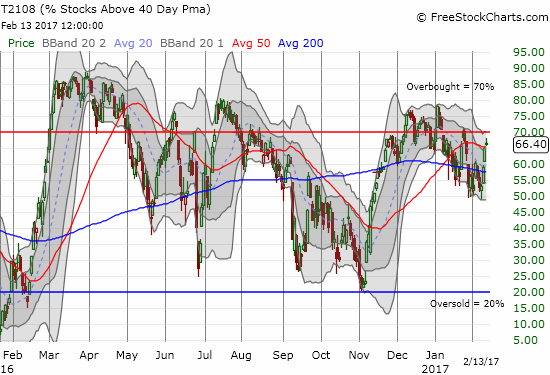
AT40 (T2108) broke out from the short-term downtrend but did not quite reach overbought levels.
Per my AT40 trading rules, a return to overbought levels should be bullish. As I have mentioned in earlier posts, even if such a bullish move occurs, I plan to leave the short-term trading call at neutral: the previous bearish divergence was long enough and the volatility is low enough to keep me wary. Note well that I greatly reduced my concern about extremely low volatility after analyzing the historical data in “The Surprising Implications of Periods of Extremely Low Volatility.”
The volatility index, the VIX, actually managed to gain a bit even as the entire stock market shot into rally mode. The gain was small enough to leave the current downtrend remained well intact.
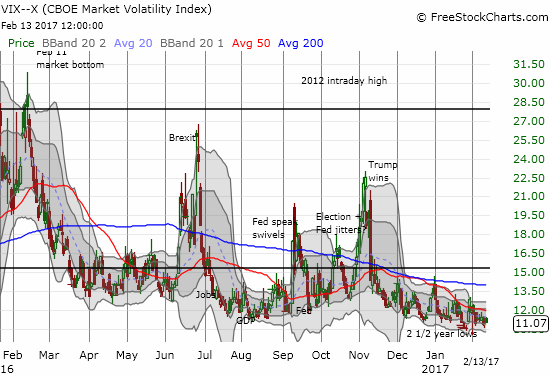
The volatility index, the VIX, gapped up and stayed positive all day despite the day’s rally in financial markets.
With the market in rally mode, my post-earnings play on Amazon.com (AMZN) worked out nicely ahead of its 2-week schedule. AMZN closed up 1.1% after completing a post-earnings reversal and almost touching its all-time high. I closed out the trade and took profits.
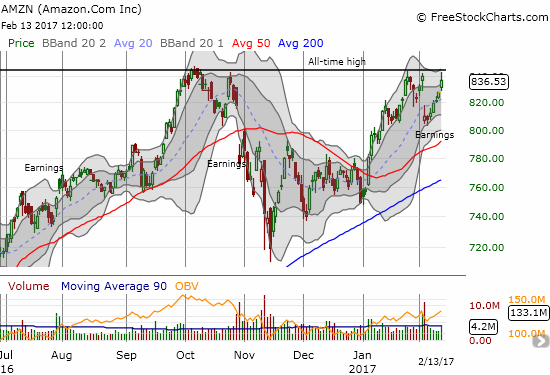
Amazon.com wasted little time in reversing its entire post-earnings loss.
I also reached back into the archives in accumulating call options on Intel (INTC). Support at the 50DMA broke decisively after INTC provided guidance at an analyst day last week. Per plan, I doubled down on my position with INTC retesting support at its 200DMA the following day. I am now looking for a repeat of early December’s picture-perfect test of 200DMA support and subsequent rally.
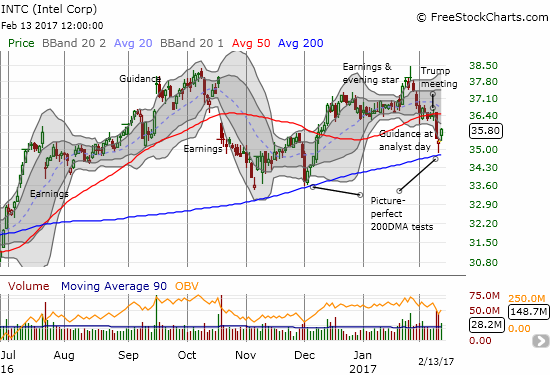
Intel bounced off 200DMA support again: did this move bring an end to post-earnings selling?
Finally, Caterpillar (CAT) completed a second post-earnings reversal. CAT neatly held support around the lows of December and January. I was thus fortunate that I did not trigger a short off a 50DMA breakdown and instead chose to wait for a breakdown of support around $91.50. CAT is now on the edge of adding its own bullish confirmation to the stock market’s current rally.
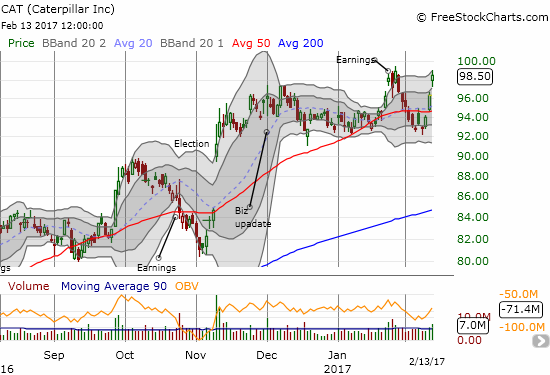
The sharp rebound for Caterpillar brings the stock close to a fresh 26-month high.
The relentless rally in iron ore is no doubt helping CAT…along with the devastating news of the struggling dam at Oroville in California. It is America’s tallest dam. The failure of an emergency spillway forced mass evacuations of surrounding communities. Some serious construction work and repair lay ahead!
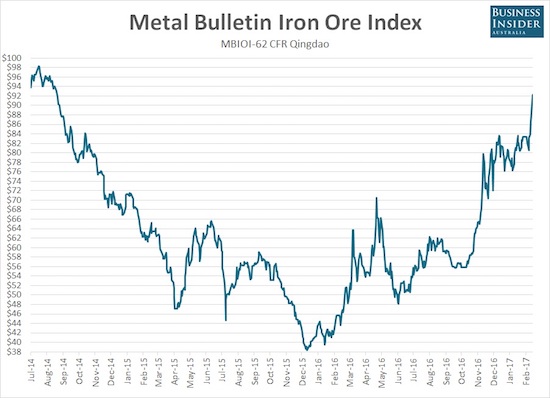
The price of iron ore kicked into a higher gear yet again. The red one has defied the odds and gravity by overcoming one blow-off top after another….
Source: Business Insider
— – —
“Above the 40” uses the percentage of stocks trading above their respective 40-day moving averages (DMAs) to assess the technical health of the stock market and to identify extremes in market sentiment that are likely to reverse. Abbreviated as AT40, Above the 40 is an alternative label for “T2108” which was created by Worden. Learn more about T2108 on my T2108 Resource Page. AT200, or T2107, measures the percentage of stocks trading above their respective 200DMAs.
Active AT40 (T2108) periods: Day #247 over 20%, Day #67 over 30%, Day #66 over 40%, Day #64 over 50% (overperiod), Day #6 under 60% (underperiod), Day #13 under 70%
Daily AT40 (T2108)

Black line: AT40 (T2108) (% measured on the right)
Red line: Overbought threshold (70%); Blue line: Oversold threshold (20%)
Weekly AT40 (T2108)

*
All charts created using freestockcharts.com unless otherwise stated
The charts above are my LATEST updates independent of the date of this given AT40 post. For my latest AT40 post click here.
Related links:
The T2108 Resource Page
You can follow real-time T2108 commentary on twitter using the #T2108 or #AT40 hashtags. T2108-related trades and other trades are occasionally posted on twitter using the #120trade hashtag.
Full disclosure: long INTC call options.
Follow Dr. Duru’s commentary on financial markets via more


