
A Market Week Headlined By Black Friday Sales & Peak U.S. Dollar Probabilities
In a holiday-shortened trading week ahead, the S&P 500 weekly expected move is now $47. That might seem like the market will express less volatility than the previous week (which held a $50 weekly expected move), but I wouldn’t hold fast and hard to that expectation given the quantitative nature of the market. We could rip sharply in either direction to start the week and retrace some of that early directional trend by the end of the week. While the trend indicates this should be the expectation investors and traders hold, when I look at dispersion I'm forced to accept the probability of holding within the SPX weekly expected move, again.
There are a couple of ways investors can review dispersion or its synonymous market definition, correlation. One is volatility dispersion. The Volatility Index (VIX) has historically seen above-average spikes higher once its daily dispersion (measured by standard deviation) has fallen to a very low-level, which it has done again in November.
The chart below shows that the weekly dispersion of the VIX has fallen below 1 for the first time in five weeks, a level that as of the previous week we’re very close to breaking under. This narrowing in the weekly dispersion was one of the early warning signs before the massive volatility spike in February. That’s not to say we will see a repeat of the February spike, but it does lend itself to the idea that complacency has flooded the volatility market as it did earlier this year.

I emphasize that volatility dispersion should be paired with other analysis and pieces of data. Other analysis should include the SKEW Index and/or the volatility of volatility index, both are not indicating outsized fear in the market or outsized levels of “black swan” hedging. That’s not to suggest hedging isn’t happening inside the marketplace, but neither index are currently setting off warning signals. The current put/call ratio indicates there is a good deal of market hedging at the moment. With that being said, since I've reviewed volatility dispersion, let’s take a look at what’s causing such dispersion levels to proliferate underneath the market’s surface.
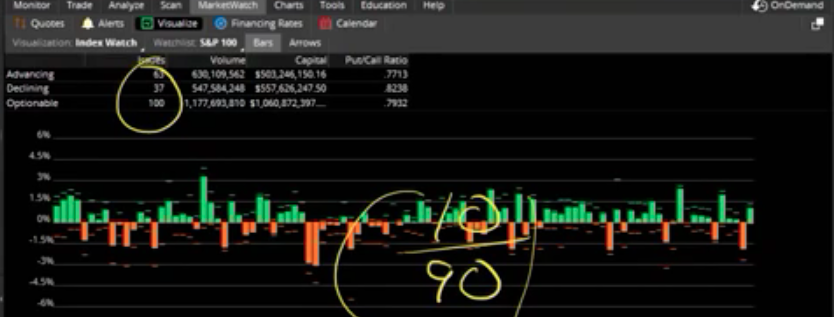
The screenshot above is of the S&P 100, advance/decline line. What one can extrapolate from the S&P 100, advance/decline line is that there is no real correlation in the market. It’s otherwise called the “whack-a-mole” market. One sector rises because another sector has been whacked lower. This is the nature of a quantitatively driven market. A correlated market would have an 80/20-90/10 advance/decline line reading. As shown above, we’re not seeing that and we generally haven’t seen that for much of the year unless the market has pulled back as it did in February and more recently in October, when all or most sectors have fallen together. In 2017 we witnessed a very correlated market, one that found stocks going higher and higher and higher through year-end and into January 2018. That was “good” market correlation. This year, we’ve had quite the opposite and on occasions.
Friday Specific
Last Friday was a very interesting trading day, headlined and likely buoyed by Federal Reserve Vice Chairman Richard Clarida. The S&P 500 Futures were set-up for continued selling pressure that deepened during Clarida’s on-air interview with CNBC. However, Clarida’s Q&A session outlined the probability of a more dovish Fed in the near-term.
Some of the biggest headwinds for equities in late 2018 have been surrounding the fear of an inverted yield curve, rising rates and a slowing global economy. Past rate hikes implemented by the Federal Reserve had indicated the central bank didn’t believe it was near the neutral rate and the verbiage of being data dependent had all been removed from its meeting notes. Clarida, however, reintroduced that verbiage, on Friday.
"As you move in the range of policy that by some estimates is close to neutral, then with the economy doing well it's appropriate to sort of shift the emphasis toward being more data dependent," Clarida said during a "Squawk Box" interview, his first public comments since being confirmed in September."
Clarida's remarks continued the process of softening the Fed's message that almost insisted it was on autopilot when it came to raising rates. His remarks emphasized the need for the Fed to be data-dependent, as interest rates move close to the lower end of the range of estimates for the neutral rate. Clarida’s comments came on the heels of Federal Reserve Chairman Jerome Powell’s comments in Dallas that seemed to recognize that global growth was indeed slowing and the central bank was sensitive to this dynamic and how it might lend itself to slowing growth in the future, domestically. Combined, Powell and Clarida’s comments went a long way toward suggesting that after a December rate hike is implemented, there could be a PAUSE before implementing a rate hike that would otherwise be scheduled for the 1st quarter of 2019.
Of course, it wasn’t just the Federal Reserve officials’ commentary that drove market activity on Friday. President Donald Trump said Friday that China "wants to make a deal" on trade with the United States, but he also warned that any pact has to be "reciprocal."
"China wants to make a deal," Trump said, adding that China had recently sent a list of trade items the nation is open to compromise on.
"Large list," Trump noted."
Trump's comments sent the Dow to its high of the day, briefly trading more than 200 points higher at session highs. But White House officials immediately after Trump's remarks told CNBC that people should not read too much into those claims, because there is no sign of a deal coming soon. Trump continues to keep the world on the edge of its seat as the trade war escalated through the summer months and the prospects for increased tariffs weigh heavily on corporate profits and investors’ outlook for equity returns in 2019. Most analysts are still of the opinion a deal will get done or further tariff implementations will be placed on hold and in favor of ongoing talks/negotiations.
The Rising $USD
A strong U.S. Dollar (USD) has also proven a headwind for corporate sales of late, but not to any incremental degree. It should also be noted, that the dollar has been strong at various points in this present expansion cycle, impacted corporate sales, but found not to impact the overall market. In short, when companies report their profit results, they tend to also report what the results would have been if not for the forex (foreign exchange rate) impact. Investors almost always ignore the forex impact as they acknowledge the fluctuation in the USD tends to find mean reversion over time. This allows investors to recognize the true strength of the company and ability to drive profits over time and absent the consideration of the USD strength.
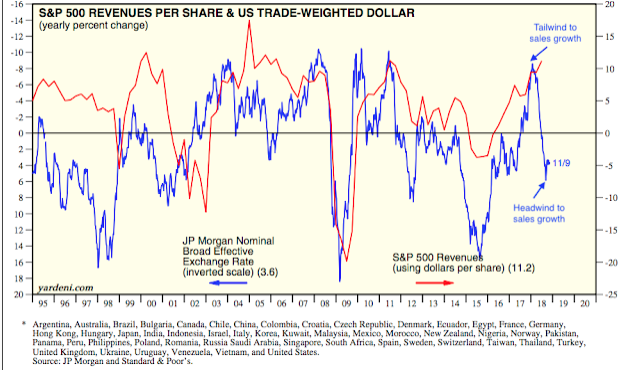
Companies in the S&P derive about half of their sales from outside of the US. When the dollar rises in value, the value of sales earned abroad falls. If foreign sales grow 5% but the dollar gains 5% against other currencies, then sales growth will be zero in dollar denominated terms. The chart below compares changes in the dollar (blue line; inverted) with growth in S&P sales (red line): a higher dollar corresponds with lower sales (from Yardeni).
Given the longevity of the current expansion cycle and multitude of other late cycle consternations, the USD strength over the last 5 weeks has raised even greater concerns for investors. With global growth slowing and a Euro and Yuan in steep decline over the last 5 weeks against the greenback, analysts have been forecasting for greater impact from the currency on U.S. corporate profits going forward.
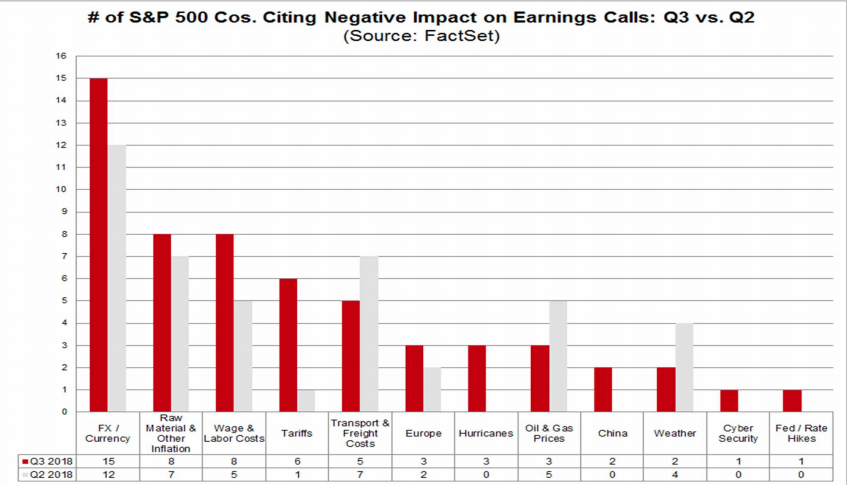
You might recall that despite the constant headlines surrounding tariffs throughout the summer and into the fall months, forex has been mentioned more by reporting companies than tariffs. At the onset of Q3 reporting season, foreign exchange was cited by more than 60% of the companies that had reported as a factor that either had a negative impact on earnings or revenues in Q3 or is expected to have a negative impact on earnings and revenues in future quarters. The number of companies citing a negative impact from forex in Q3 was 25% higher than the number of companies that cited a negative impact from this factor in Q2 (12) at about the same point in the reporting season.
Since the start of the earnings season, more and more companies have cited forex as impacting sales, not so much earnings. To this point, it hasn’t proven to offset the outsized earnings beats that have occurred during the quarter, which finds S&P 500 earnings growing above 25% year-over-year. Nonetheless, given the prevailing late cycle sentiment that accompanies the strong USD, investors and analysts consider the variable a headwind going forward. But Morgan Stanley disagrees with the current sentiment and is also calling for a temporary top in the USD.
“We believe the USD has reached its peak at around current levels,” Morgan Stanley’s global head of FX strategy Hans Redeker wrote in a note. “The USD may weaken as credit spreads widen, equity prices fall, and sovereign bond yields also begin falling amid disinflationary pressure and falling oil prices.”
Moreover, the probability of a near-term top seems a high probability. From a technical perspective, conditions are overbought for the USD index. There is decent support at just north of 95 and the boat may begin to lean in the other direction very soon. Statistically speaking, while a near-term top may present itself very soon, more gains over longer duration time frames has been proven historically. Here’s what the USD Index tends to do next when it goes up 5 weeks in a row. (See table below from Troy Bombardia)

While the statistics don’t lie and when combined with the negative sentiment towards corporate profits from a strong USD, historically speaking this hasn’t proven a net negative for the market. As we stated previously, investors tend to ignore the forex impact on corporate earnings given the fluctuations that underline this variable and which show mean reversion over time. Since at least 1974, a strong USD has not found a net negative impact on the S&P 500.
With regards to Morgan Stanley’s latest USD forecast, the firm suggests that recent foreign flows into U.S. assets have been short-term and are prone to a quick reversal, which could be another sign that dollar weakness may come.
“Instead of strong inward foreign direct investment or other long-term flows, we see evidence that flows to the U.S. have been into money market funds and are carry trade motivated,” Redeker said.”
Morgan Stanley has joined a growing pool of banks that think the greenback’s strength is waning. Goldman Sachs’ foreign-exchange strategy team said the greenback is approaching a peak, which should relieve pressure on currencies such as the Yuan. Credit Agricole also sees a weaker dollar after the Democrats took control of the House of Representatives at the U.S. midterm.
What’s In Store This Week
It’s anybody’s guess as to how the market will perform in this holiday-shortened trading week. What we know for certain is that the market's valuation has become increasingly cheap since the start of earnings season and valuations matter. The S&P 500 forward 12-month P/E ratio is 15.6. This P/E ratio is below the 5-year average of 16.4, but above the 10-year average of 14.5. Keep in mind that when calendar year 2019 commences, the 10-year average will likely increase as it eliminates the impact from 2008’s Great Financial Crisis period.
It's Black Friday week for retailers this week. Retail holiday sales are expected to increase a robust 5 to 5.6% over last year’s shopping season, according to Deloitte’s annual retail holiday sales forecast. Deloitte’s Retail and Distribution practice expects total holiday sales (seasonally adjusted and excluding motor vehicles and gasoline) to exceed $1.10 trillion between November and January. Additionally, Deloitte forecasts a 17 to 22% increase in e-commerce sales in 2018 compared with 16.6 percent in 2017. E-commerce sales are expected to reach $128 to $134 billion during the 2018 holiday season. Deloitte’s forecast compares favorably to the National Retail Federation forecast that expects holiday retail sales in November and December, excluding automobiles, gasoline and restaurants, to increase between 4.3 and 4.8% over 2017 for a total of $717.45 billion to $720.89 billion.
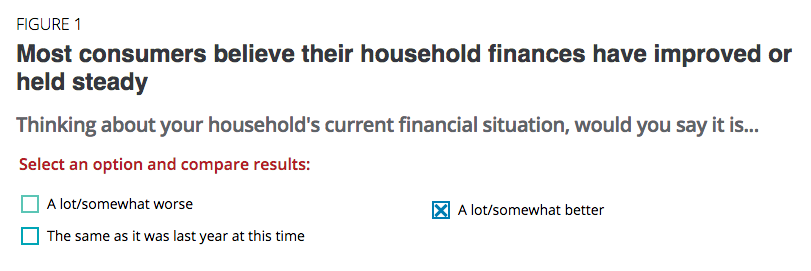
“Consumers are upbeat about the economy—73 percent believe that the economy will either continue to improve or remain stable in the coming year, with less than a third expecting a slowdown. In matters closer to home (figure 1), the majority of consumers believe their own household situation has improved or has remained unchanged in the past year.”
A perception of a strong economy, as well as robust household financials, are the main drivers of holiday spending. According to Deloitte’s survey, consumers indicate their average holiday spend will increase from US$1,226 to US$1,536 per consumer. Most consumers (78 percent) report they plan to spend more or the same amount as they did last year (figure 2).
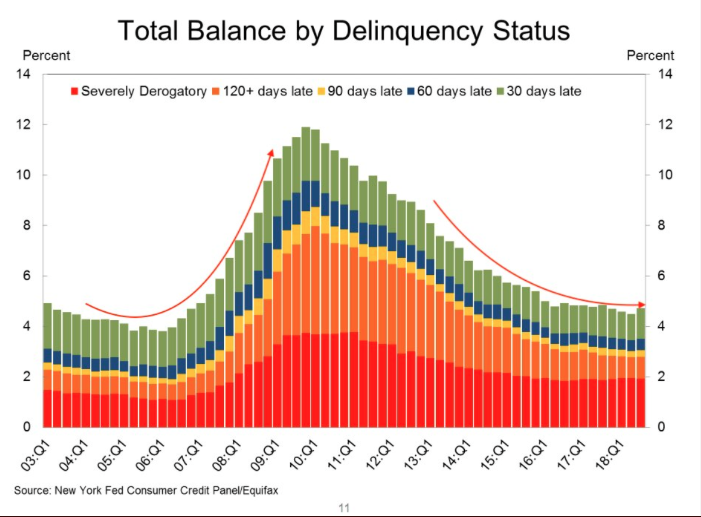
For those planning to spend more, not surprisingly, the primary reasons given were improved household situation and more confidence in the economy. For those indicating less spend, the primary reasons given had to do with saving more than spending and paying down debt. When it comes to household debt, it's important to understand that delinquency rates continue to decline year-over-year.
When it comes to the week ahead, the economic data will largely surround the housing market. Existing home sales, building permits and housing starts data will all headline the week. We’re skeptical that the data surrounding housing will have dramatically changed from the previous month, even as mortgage rates leveled off last week. Also during the week, 20 S&P 500 companies are scheduled to report results for the third quarter.

S&P 500 Corporate Earnings
While earnings have continued to come in better than anticipated and throughout the Q3 reporting seasons, valuations have come down, bucking the historic trend at present. Now let’s take a look at Thomson Reuters Q3 S&P 500 earnings forecast.
S&P 500 Aggregate Estimates and Revisions
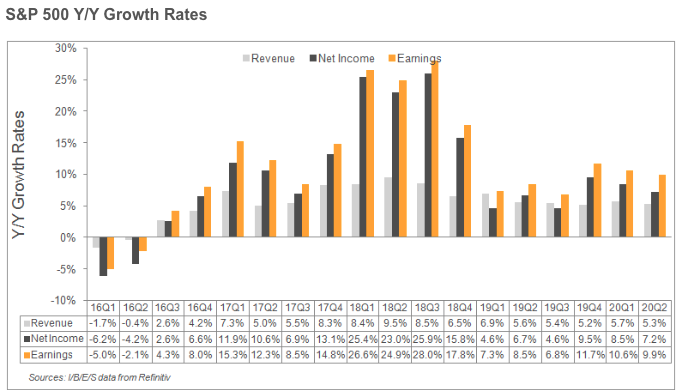
- Third quarter earnings are expected to increase 28.0% from Q3 2017. Excluding the energy sector, the earnings growth estimate declines to 24.6 percent.
- Of the 456 companies in the S&P 500 that have reported earnings to date for Q3 2018, 77.6% have reported earnings above analyst expectations. This is above the long-term average of 64% and in-line with the prior four-quarter average of 77 percent.
- The Q3 2018 blended revenue growth estimate is 8.5 percent. Excluding the energy sector, the revenue growth estimate declines to 7.4 percent.
The Final Word/Investor Takeaways
I do not believe the current expansion cycle is best compared to its’ predecessors. There are simply too many nuanced and unique aspects to the current expansion cycle that is most aptly highlighted by the late cycle tax cuts, for better or for worse. Earnings and sales beats to the extent they have beaten estimates during 2018 serve to underline just how “behind the curve” analysts and economists have been with their forecasts, largely due to underestimating the impact from tax reform.
The issue is rather simple or more simplistic when one focuses on profits and blocks out the headlines. The headlines are more supposition than reality at the moment. In terms of what investors fear most it always comes down to earnings. Next year, the consensus expects 9% earnings and 5% sales growth. Sales growth expectations may be fine (barring major dollar appreciation), but the expected earnings growth may prove too optimistic. Think about it; earnings are expected to grow faster than sales again in 2019 and after margins hit record levels in 2018. Is it possible, yes! Is it probable, not really! The laws of large numbers make it a lesser probability.
For earnings to grow faster than sales, margins have to expand. But after trending higher over the past 7 years, margins jumped 260bp in just the past three quarters of 2018. This is a massive rise and sustaining that level is too aggressive an assumption given reflation. Maybe the strong dollar will weaken due to trade deals coming to fruition and global growth rejuvenation, but these are big maybes.
It’s quite probable that earnings estimates will come down in 2019 and to a level that more appropriately mirrors sales growth. A good deal of this particularly pessimistic probability is assigned to the current, trending impact from tariffs and forecasted future impact of additional tariffs, the strong USD, bear market in crude oil and rising rates. The optimistic way of looking at this is under the premise of “what if”. What if a major trade deal or trade concession deal is reached that halts future tariff implementation and/or eliminates existing tariffs? Based on recent headlines, that’s a decent probable outcome. What if the Fed pauses after its December rate hike, which recent commentary points toward occurring? What if Brexit finds a solution and an Italian budget is agreed to with the EU? All the aforementioned have resulted in market multiple compression through 2018 is man-made and can be resolved rather quickly. The headwinds of the day can prove tailwinds for market multiples thereafter. But… we’re not quite there yet.


