
A Market Filled With Ifs
“You do not really understand something unless you can explain it to your grandmother.” Proverb
Retail is the Modern Family grandmother and about 70% of the gross domestic product. Hence, if we are to understand the market, we must explain how Granny impacts it. And, we must make that explanation easy.
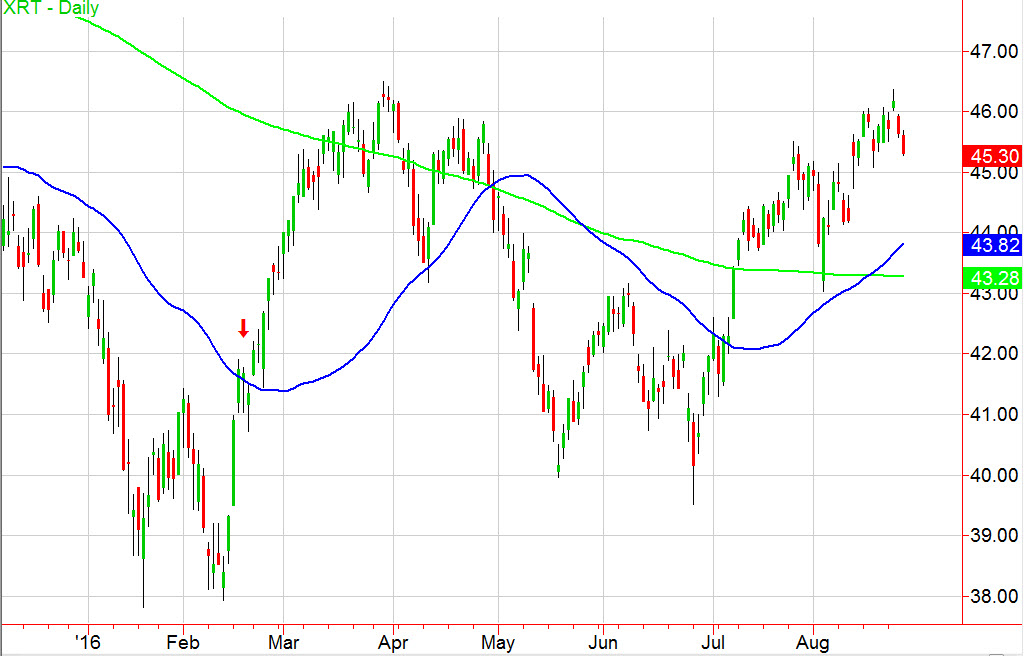
Above is the daily chart of XRT, one ETF for Retail. With the 50 above the 200 day moving average, it is in a bullish phase.
Consumer confidence shows the biggest two-week gain since 2009.
Retail names like Tiffany’s (TIF), Nordstrom’s (JWN) and Macy’s (M) have come back from the dead. Lululemon (LULU) is trading near all-time highs.
If the consumer drives the U.S. economy, will Retail lead the GDP and the rest of the stock market higher?
Incidentally, the largest holding in XRT is Finish Line Inc. (FINL). It cleared the 200 week moving average for the second week in a row, an accomplishment the stock has not made since a year ago.
Simply put, a move through 46.00 in XRT looks great.We see near-term price support at 45.00. Plus, XRT can easily fall to 44.00 and still look good.
Looking at the Russell 2000, Granny’s husband or Granddad, he held the 10 DMA. Like his betrothed, the 2000 small caps represent the U.S. economy as 99.30% of the holdings are located in the U.S.
Thus technically speaking, if IWM holds up, then Granny should as well. IWM must get back over 123.60 and hold 121.00.
Lots of cynicism prevails about the Fed’s next move. Some analysts have suggested that the Fed is primarily driven by politics not monetary policy, especially ahead of the presidential election.
Perhaps. But how do snarky comments and speculation help traders? They don’t. Great cocktail party talk, yet at the end of the day we still need a roadmap.
Treasury Bonds (TLT) fell again today. So did XRT. IWM on the other hand, rose.Rates firmed, Retail falters to the pressure. IWM holds steady.
Simple correlations for now.
If
If rates rise and retail and small caps fall, yes indeed, the Fed jumped ahead of any confirmation of a growing economy. (Not to mention disprove any political motivation).
If rates stay the same and XRT and IWM both rise, surmise that monetary policy as is continues to give the market confidence.
If rates rise and so do XRT and IWM? Market discounted all the hoopla and the U.S. is doing just fine.
If rates stay the same and XRT and IWM drop regardless, take that as a cautionary and possibly recessionary tale.
If you can repeat that so your grandmother understands, well done!
S&P 500 (SPY) Must hold 217 or could see 214. Through 218.50 better
Russell 2000 (IWM) 122.95 pivotal. 121 the ultimate support. A return back over 123.60 will help a lot
Dow (DIA) If cannot get back over 185.55 possible to see 182 then 180
Nasdaq (QQQ) 116 support to hold. I do see a potential double top this month.
XLF (Financials) Rotation into this sector. 23.90 area is pivotal support.
KRE (Regional Banks) Inside day with 42.00 big resistance and next point to clear. 40 key support but first 41.40
SMH (Semiconductors) Inside day above the 10 DMA
IYT (Transportation) Maybe not as important as XRT, IYT nonetheless is not supporting an improving economy at this point
IBB (Biotechnology) Shake out those speculators. Held the 50 and 200 DMA
XRT (Retail) 45 support
ITB (US Home Construction) 28.90 support. Looks good
GLD (Gold Trust) Confirmed warning phase. Only metal we still have a tail in. Not discounting this just yet. Like better over 127.20
GDX (Gold Miners) 26.40 support
USO (US Oil Fund) Inside day. 11.35 the weekly MA to clear-until then noise
XOP (Oil and Gas Exploration) Still like this
TAN (Guggenheim Solar Energy) confirmed return to bearish phase
TLT (iShares 20+ Year Treasuries) 138.95 the 50 DMA which it’s been above since June 1.
UUP (Dollar Bull) 24.54 resistance.
Disclosure: None.


