
5 Mid Caps To Consider
Today I used Barchart to sort the S&P 400 Mid Cap Index stocks to find the stocks with good technical indicators and upward momentum. As always I used the Flipchart feature to review the charts.
Today's list includes Royal Gold (NASDAQ:RGLD), Lexmark International (NYSE:LXK), Kate Spade & Co (NYSE:KATE), Jetblue Airways (NASDAQ:JBLU) and Cinemark Holdings(NYSE:CNK):
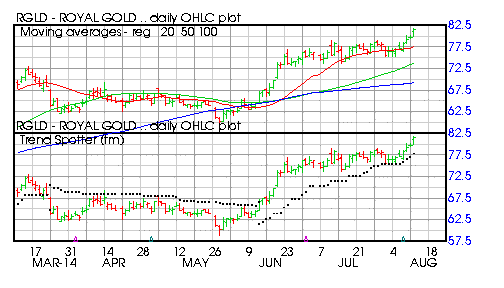
Barchart technical indicators:
- 100% Barchart technical buy signals
- Trend Spotter buy signal
- Above its 20, 50 and 100 day moving averages
- 8 new highs and up 4.25% in the last month
- Relative Strength Index 70.21%
- Barchart computes a technical support level at 79.06
- Recently traded at 81.57 with a 50 day moving average of 73.78
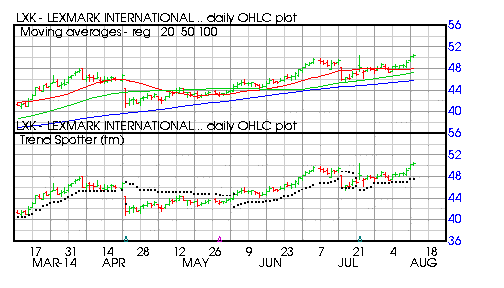
Barchart technical indicators:
- 100% Barchart technical buy signals
- Trend Spotter buy signal
- Above its 20, 50 and 100 day moving averages
- 3 new highs and up 3.23% in the last month
- Relative Strength Index 67.06%
- Barchart computes a technical support level at 48.89
- Recently traded at 50.46 with a 50 day moving average of 47.28
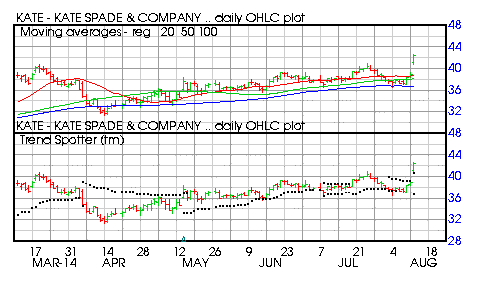
Barchart technical indicators:
- 100% Barchart technical buy signals
- Trend Spotter hold signal
- Above its 20, 50 and 100 day moving averages
- 7 new highs and up 12.32% in the last month
- Relative Strength Index 73.32%
- Barchart computes a technical support level at 37.84
- Recently traded at 41.68 with a 50 day moving average of 38.13
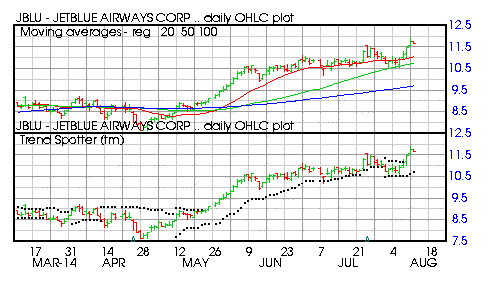
Barchart technical indicators:
- 100% Barchart technical buy signals
- Trend Spotter buy signal
- Above its 20, 50 and 100 day moving averages
- 5 new highs and up 7.95% in the last month
- Relative Strength Index 65.51%
- Barchart computes a technical support level at 11.33
- Recently traded at 11.67 with a 50 day moving average of 10.75
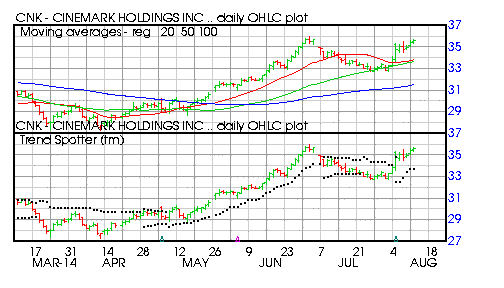
Barchart technical indicators:
- 100% Barchart technical buy signals
- Trend Spotter buy signal
- Above its 20, 50 and 100 day moving averages
- 5 new highs and up 4.45% in he last month
- Relative Strength Index 68.61%
- Barchart computes a technical support level at 34.75
- Recently traded at 35.59 with a 50 day moving average of 33.66
Disclosure: None
How did you like this article? Let us know so we can better customize your reading experience.

Comments
Leave a comment to automatically be entered into
our contest to win a free Echo Show.

