
Right Back Where The Stock Market Started, But Worse
AT40 = 25.5% of stocks are trading above their respective 40-day moving averages (DMAs)
AT200 = 23.4% of stocks are trading above their respective 200DMAs (just off a 32-month low)
VIX = 23.2 (as high as 24.7)
Short-term Trading Call: cautiously bullish
Commentary
I am surprised the stock market has yet to close in oversold conditions. AT40 (T2108), the percentage of stocks trading above their respective 40DMAs, dropped to 25.5%. Its lowest close at the end of November’s sell-off was 23.4%. It is too much to expect that the stock market will once again bounce from these levels, but it just so happens that the S&P 500 (SPY) also closed even with that November low.
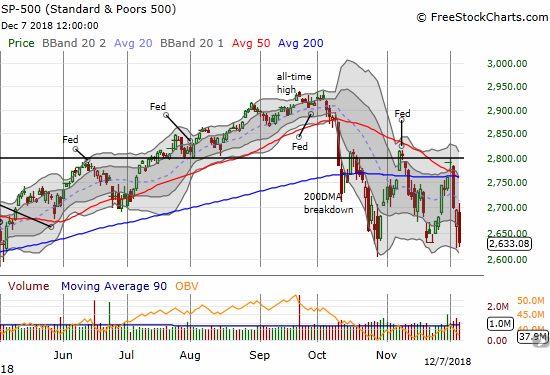
The S&P 500 (SPY) lost 2.3% and closed right at the November low. The 2018 low is in play.
That November low was important because it matched the October low which marked deep oversold territory. That oversold period was so extreme that I described a “second derivative” moment:
It is a “second derivative” moment when the selling becomes so extreme that the bull market itself gets questioned and scenarios for a bear market loom more possible. It is a moment when the extreme of an oversold condition itself reaches historical extremes, and market participants should start considering a wider range of potential outcomes. This is the point where I expect the next rally out of oversold conditions to lead to an opportunity for selling and/or shorting. Resistance at 200DMAs loom larger and larger.
Above the 40 (October 24, 2018) – The Second Derivative Is Here for the Stock Market (New Oversold Extremes)
This bearishness played out in the form of two failed rallies which both got rejected from 50 and/or 200DMA resistance levels. The first rally started after AT40 created a bullish divergence with the S&P 500. The second rally also followed a bullish divergence that was milder than the first, so I did not act on it until a rise in the S&P 500 seemed to confirm the divergence. With these observations in mind, I will act aggressively on another bullish divergence. However, I fully expect this latest sell-off to plunge the market into oversold conditions before it ends. The short-term trading call stays at cautiously bullish in deference to the possibilities for an imminent rebound.
AT200 (T2107), the percentage of stocks trading above their respective 200DMAs, remains an important part of the technical picture. AT200 closed at 23.4% and a fresh 34-month low. So while the market is still able to deliver rallies in the short-term, the longer-term picture continues to deteriorate. These are more signs of bear market action. Traders should still sell rallies. As an example of my creeping longer-term bearishness, I started reducing my equity exposure in longer-term investment accounts (I still intend to plow those funds back into the market on a steeper sell-off).
The NASDAQ and the Invesco QQQ Trust (QQQ) have yet to reach the dire positioning of the S&P 500 (SPY). Both tech laden indices are still well off their November lows. However, this achievement may mean little considering they breached their October lows. In other words, these indices may be headed for another lower low; such moves would be consistent with the bearish action unfolding on the failures at MA resistance and the associated lower highs.
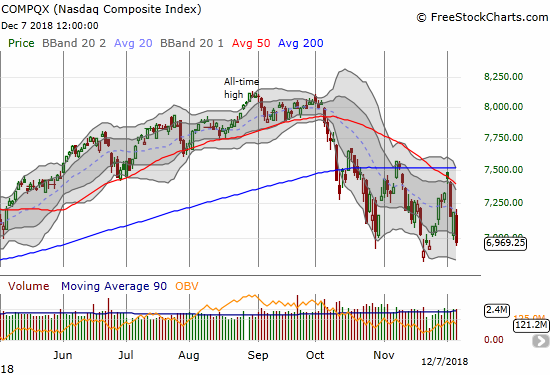
The NASDAQ lost 3.1% and almost finished reversing the gains from the last low.
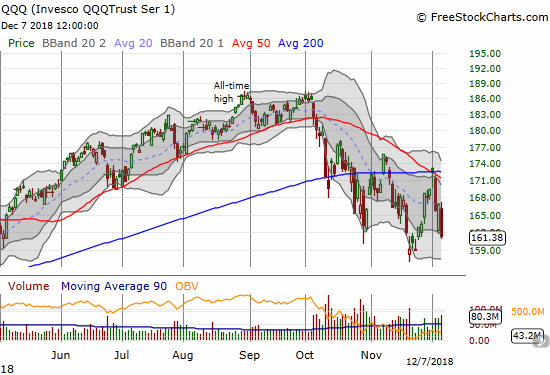
The Invesco QQQ Trust (QQQ) plunged again for a 3.3% loss and put its November low back into play.
The volatility index, the VIX, is supportive of an imminent bounce. The fear gauge closed with a gain from Thursday but never surpassed the intraday high for Thursday. I chose to accumulate put options on ProShares Ultra VIX Short-Term Futures (UVXY).
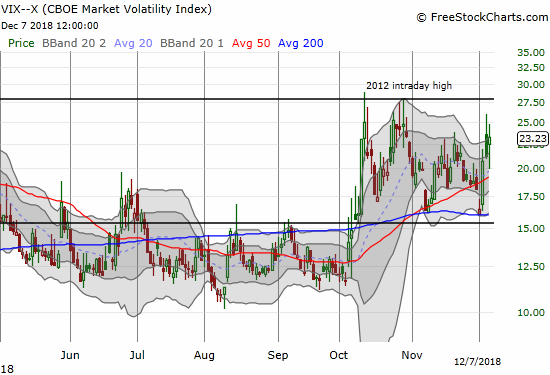
The volatility index, the VIX, jumped 9.6% but never broke the intraday high from the previous day.
The iShares Russell 2000 ETF (IWM) remains worrisome. This small cap index ended the week at a closing 15-month low. The index too easily confirmed resistance at its 50DMA. Still, I have IWM in my sights for speculating on call options if the market flips oversold. I would target the rapidly declining 50DMA resistance for a rebound.
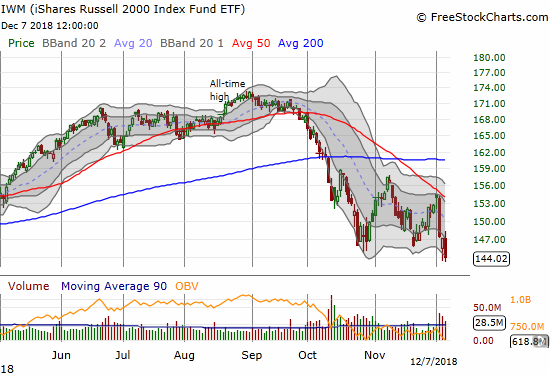
The iShares Russell 2000 ETF (IWM) closed at a new 15-month closing low with a 2.2% loss on the day.
Financials are in the same leaky boat as small caps. The Financial Select Sector SPDR ETF (XLF) lost 1.9% with a new 15-month closing low. I have returned to betting against financials with a focus on the hapless Goldman Sachs (GS). I took profits on my latest calendar put spread after GS punched right through my $180 strike price. I was hoping the short side would expire worthless and leave me positioned for the coming week with a fistful of long GS put options. GS closed the week at a 26-month low and finished reversing its entire post-election breakout. This is a notable end to an important Trump trade! Dare I say it is a sign of more to come? The arrows are certainly pointing that way…
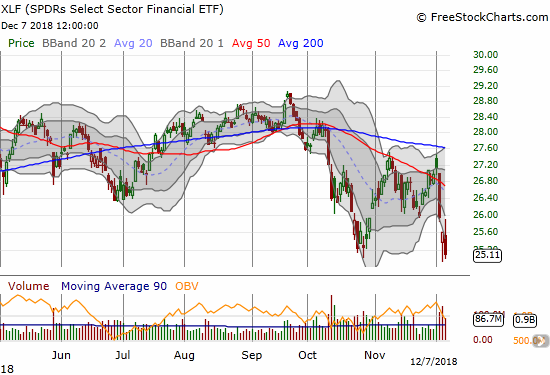
The Financial Select Sector SPDR ETF (XLF) lost 1.9% with a new 15-month closing low.
Finally, at the time of writing, the currency markets are pointing to more weakness to start the week. The Australian dollar (FXA) versus the Japanese yen (FXY) confirmed a 50DMA breakdown. AUD/JPY is back in bearish territory and completes a net worsening picture for the stock market. I am sticking by my long position only because the fundamentals for the Australian economy looked good based on last month’s employment report (those of you who read and listen to market pundits are very familiar with this kind of rationale for stubborn bullishness!).
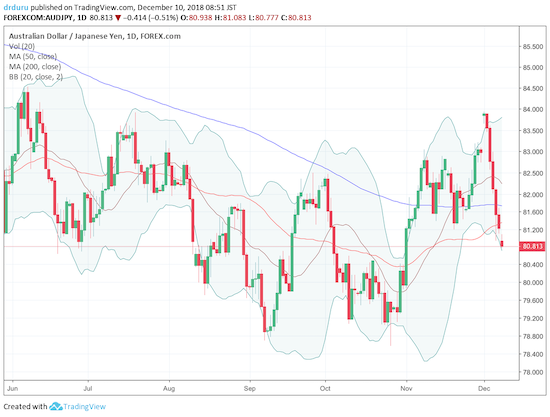
AUD/JPY continued to drop below 50DMA support. The recent lows are back in play.
Source: Trading View
CHART REVIEWS
Acacia Communications (ACIA)
Given all the drama with U.S. versus China trade relations, I am very surprised that ACIA has held up relatively well. Although it broke through 50DMA support, the stock is still holding onto a gain from the November gap-up. I want to go back to shorting this stock, but I do not like going after relatively strong stocks even in a weak tape.
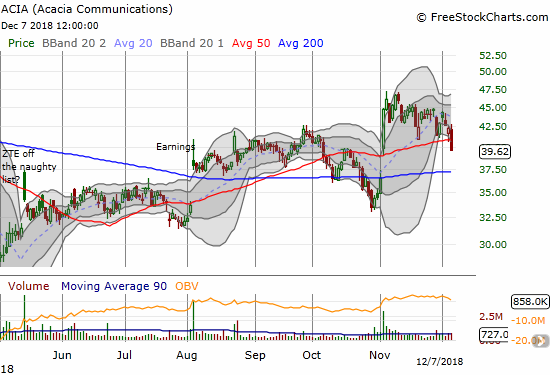
Acacia Communications (ACIA) broke down below its 50DMA on a 6.3% loss.
Applied Materials (AMAT)
I bought AMAT on the confirmation of the 50DMA breakout. Last week, the stock fell right back. This is another example of bear market type behavior. I was planning on adding shares to my call options, but now I am on hold.
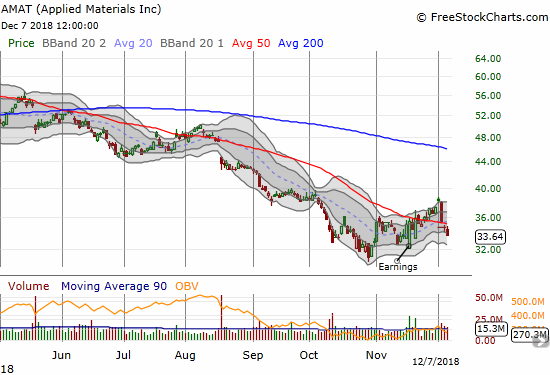
Applied Materials (AMAT) lost 3.0% and confirmed a fresh 50DMA breakdown.
Advanced Micro Devices (AMD)
I bought puts in AMD ahead of what I thought was an imminent break of 200DMA support. That break is likely still coming, but the puts already expired worthless. I should have waited for what was a perfect fade at 50DMA resistance.
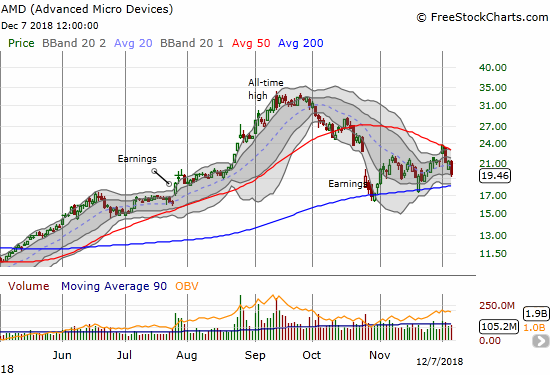
Advanced Micro Devices (AMD) lost 8.6% on a continuation of a confirmed failure at 50DMA resistance. Support at its 200DMA is back in play.
Boeing (BA)
After mistiming a bullish play on BA on the early November 50DMA breakout, I did not return with a new trade. Too bad – the stock has swung widely and wildly from breakout to support to resistance and back to support. If BA slips further, I will assume the stock has printed a sustained top.
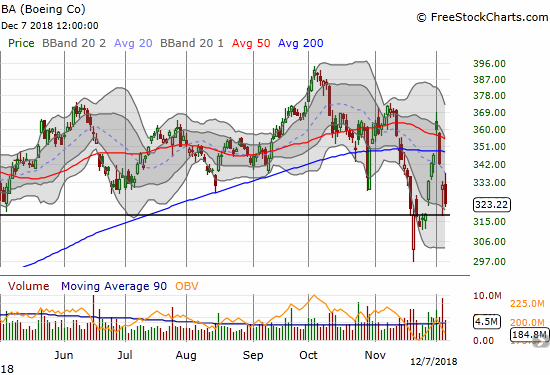
Boeing (BA) confirmed a lower high in what still looks like an extended topping pattern. The stock sliced right back through its 50 and 200DMAs.
Best Buy (BBY)
BBY is almost finished reversing its breakout from November, 2017. The stock closed at a 52-week low and confirmed its downtrending 20DMA as resistance. BBY was one of the stronger stocks in the retail space, so its persistent weakness is one more confirmation of what I called the top in retail stocks back in October (too bad I did not quickly recognize even bigger implications at that time). I completed taking profits from a calendar put spread. I am eyeing BBY for a fresh bearish position.
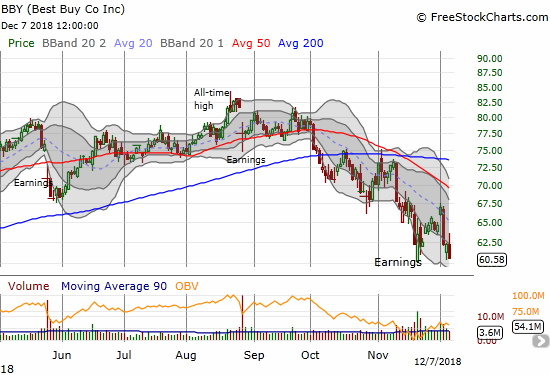
Best Buy (BBY) plunged from its declining 20DMA ending the week at a new 52-week low. A complete reversal of its late 2017 breakout is back in play.
Baidu (BIDU)
BIDU is yet one more stock that neatly failed at resistance. BIDU’s 50DMA continues to define the downtrend. I bought a call option in the middle of the big December 4th sell-off in anticipation of a quick bounce back toward resistance. The stock now looks like it wants to break down below support.
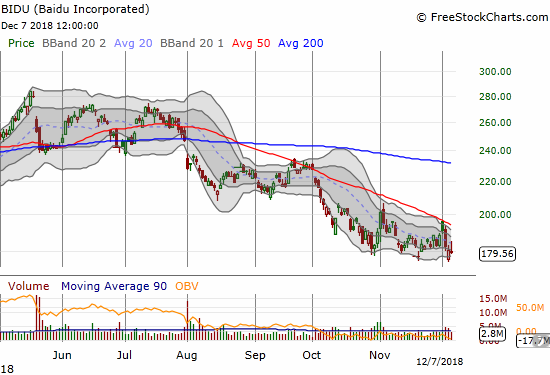
Baidu (BIDU) lost 0.6% after sellers swiftly faded a healthy intraday gain. Recent lows are critical support.
Caterpillar (CAT)
CAT gapped right into 200DMA resistance and sold off from there. It was one of several early tells that the post-G20 euphoria would not last. I made two fresh trades in puts. I took profits on the second tranche given the potential for CAT to hold support from its November low. Whether the stock breaks down further or rallies, I will be buying more puts on CAT in the coming days and weeks.
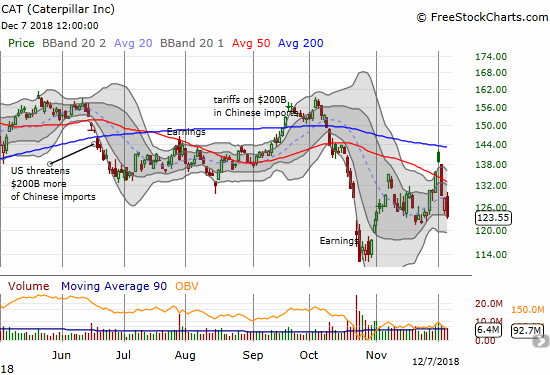
Caterpillar (CAT) lost 3.8%. The stock confirmed another 50DMA breakdown but it is still well off its recent lows.
DexCom (DXCM)
DXCM was my big fish of the year that got away. The stock continues to hold up relatively well through the various sell-offs, granted the stock is stuck in a 4-month trading range where the 50DMA is looming ever larger as resistance. I am watching closely for a potential test of 200DMA support. Per AT200, DXCM is part of a very small group of stocks still trading above this important support.
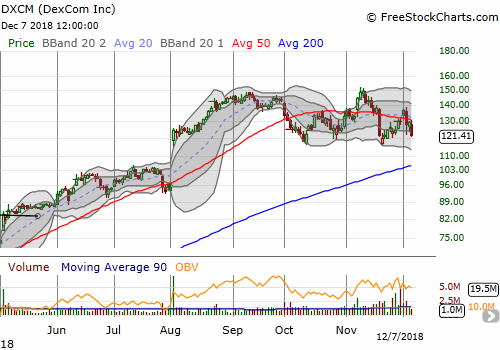
Dexcom (DXCM) lost 6.2% and confirmed a new 50DMA breakdown. An extended topping pattern may be forming.
Fluor (FLR)
My attempt to buy FLR on the cheap after post-earnings weakness failed spectacularly. With the stock trading at levels last seen in early 2009, I am even more interested in buying for a long-term play; pessimism on this important infrastructure company is extremely high. I am in NO rush to buy though.
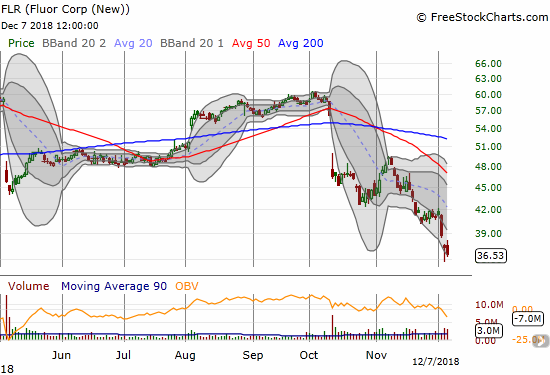
Fluor (FLR) lost 2.2% to close at a more than 9 1/2 year low.
SPDR Gold Trust (GLD)
GLD is on the move. The steady climb is consistent with a market that is getting ready for the Federal Reserve to capitulate on rate hikes. I should have bought last week’s breakout. I will be moving quickly to make a short-term trade to complement my core shares. For now, I am not even worried about looming 200DMA resistance. The wind is behind gold’s sails.
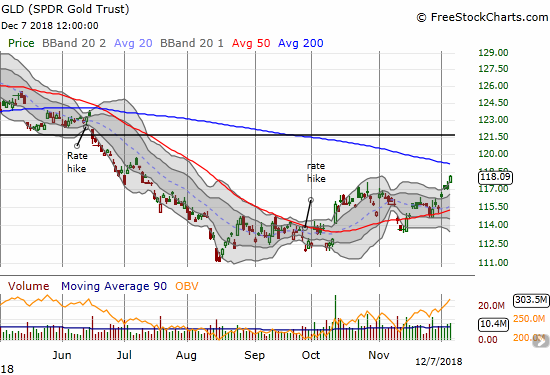
The SPDR Gold Shares (GLD) gained 0.8% for a 5-month high.
General Motors Company (GM)
The Trump Trade in GM is already a distant memory. I used last week’s sell-off to take another swing even as all the optimism over plant closures and layoffs has completely reversed. I am looking for the 50DMA to hold as support, but I am prepared for it to fail on further market weakness.
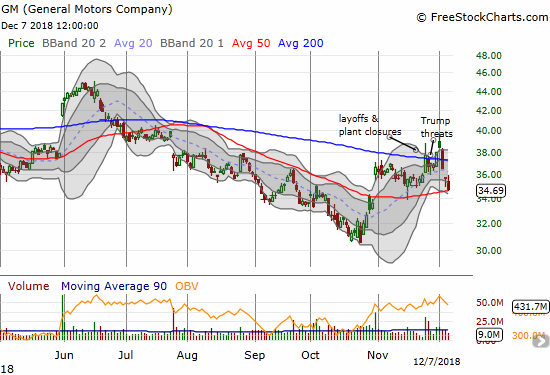
General Motors (GM) lost 2.8% and clung to 50DMA support. The stock confirmed a 200DMA breakdown and is close to filling the October 31st gap up.
Intel (INTC)
Intel finally dropped back to 50DMA support and gave me the next buying opportunity I was anticipating. This “opportunity” could quickly turn into fool’s gold as support gave way on Friday. This breakdown puts the October low into play. I have also duly noted that the 200DMA is confirmed as stiff resistance…as with so many stocks.
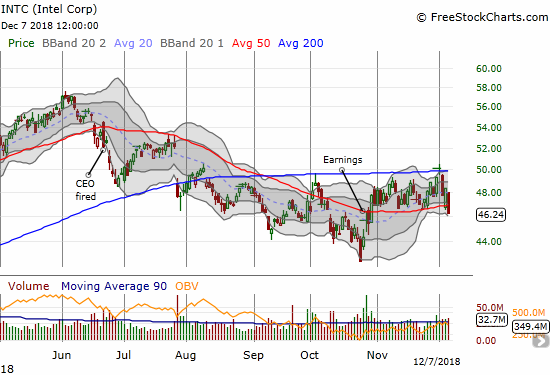
Intel (INTC) lost 4.4% and pushed through its 50DMA for the first time in 6 weeks.
Nike (NKE)
NKE rejoined the vast majority of stocks now trading below their 200DMAs. Fortunately for NKE it still has firm support just below current levels. Unfortunately for NKE, a declining 50DMA is threatening to slowly but surely keep pressuring the stock downward.
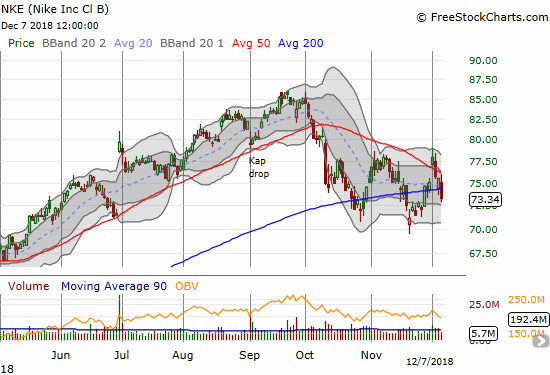
Nike (NKE) closed below its 200DMA again with a declining 50DMA applying additional pressure.
iShares 20+ Year Treasury Bond ETF (TLT)
Even more than GLD, TLT is behaving as if investors anticipate a capitulation from the Federal Reserve. TLT launched off 50DMA support last week although the 200DMA held tight as resistance. Now can rate-sensitive stocks benefit? Home builders anyone?
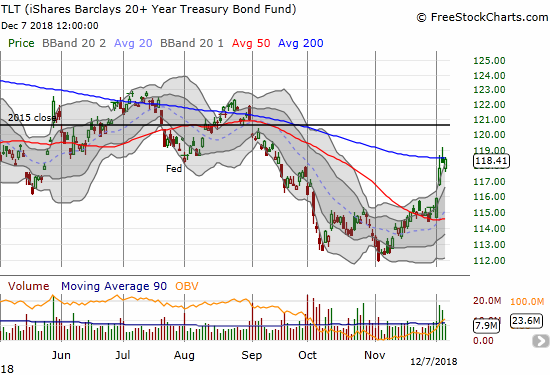
The iShares 20+ Year Treasury Bond ETF (TLT) soared this week but could not break through 200DMA resistance.
Toll Brothers (TOL)
TOL made an impressive post-earnings rebound from a near disastrous low, but the stock has yet to show additional momentum. The stock conspicuously failed at intraday highs for 3 days in a row. The good news is that if/when TOL manages to break through this logjam, it will be a VERY strong buy at least to 200DMA resistance. I am on alert as always with home builders.
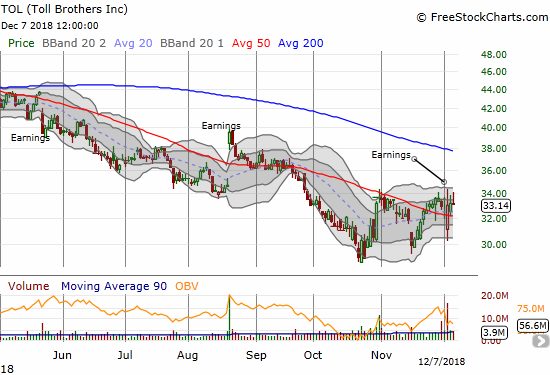
Toll Brothers (TOL) raced higher to the recent intraday highs only to get pushed back to a 0.2% loss.
Tesla (TSLA)
TSLA is on an impressive counter-trend run. Lately, the stock almost seemed to feed off market weakness. I was wondering whether “someone” knew “something” and then I heard on Friday about the upcoming 60 Minutes interview with CEO Elon Musk. TSLA was on the edge of cracking its way to a new closing all-time high, but even TSLA ended up succumbing to the market’s selling pressure. It went from a healthy 4.5% gain to a 1.4% loss.
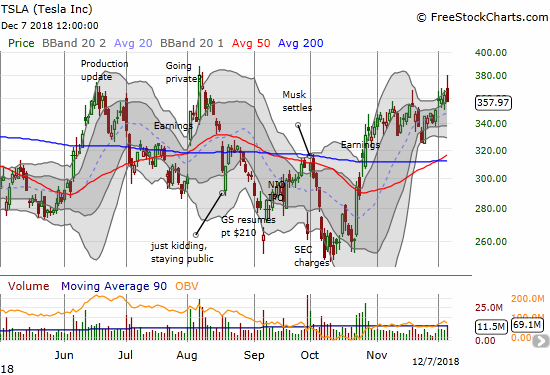
Tesla (TSLA) has been out-performing the market but even the sellers were able to fade TSLA on this day for a 1.4% loss.
United States Oil (USO)
USO broke above its congestion. Per my prior discussion on USO, I assumed this move confirmed the bottoming pattern. I actually neglected to buy my call options on the breakout, but jumped on the trade on Thursday’s dip. I was very fortunate that the OPEC meeting resulted in a production cut. I decided not to take profits. With a January expiration, I have plenty of time to see whether buyers can continue some momentum. Sellers faded USO down to a 1.6% gain.
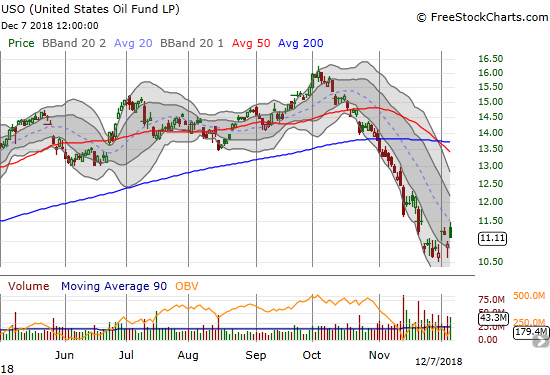
United States Oil (USO) gapped higher but closed with just a 1.6% gain. The downtrending 20DMA held as resistance.
Wynn Resorts (WYNN)
WYNN was a huge beneficiary of the post G20 euphoria. The stock gapped up for a 50DMA breakout and 9.5% gain. It was a very bullish move. The next day, the sellers pushed the stock back under the 50DMA. WYNN lost another 6.6% on Friday. I had a calendar call spread in place ahead of the G20, but the move on Monday was so strong that I gained little (Dec/Jan $115). Ironically, I now have more profit on the position with the stock back down to $104.99.
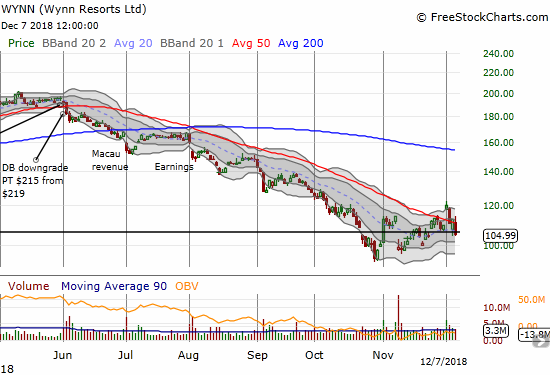
Wynn Resorts (WYNN) lunged 6.6% and confirmed the end of its earlier breakout.
Yelp (YELP)
My call options hit their profit target and sold at the gap open on Friday. Just in time: sellers took over from there. YELP stays on my radar for buying on the dips given the stock buyback program underway. YELP is slowly recovering from last month’s post-earnings disaster.
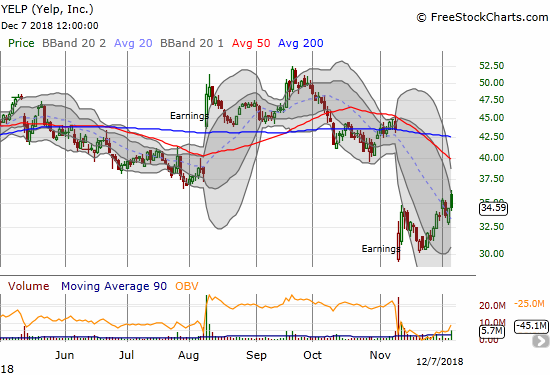
Yelp (YELP) gapped high enough at the open to cling to a 0.5% gain after sellers ended the beating at the close.
— – —
“Above the 40” uses the percentage of stocks trading above their respective 40-day moving averages (DMAs) to assess the technical health of the stock market and to identify extremes in market sentiment that are likely to reverse. Abbreviated as AT40, Above the 40 is an alternative label for “T2108” which was created by Worden. Learn more about T2108 on my T2108 Resource Page. AT200, or T2107, measures the percentage of stocks trading above their respective 200DMAs.
Active AT40 (T2108) periods: Day #25 over 20% (overperiod), Day #1 under 30%(underperiod, ending 8 days over 30%), Day #3 under 40%, Day #53 under 50%, Day #69 under 60%, Day #122 under 70%
Daily AT40 (T2108)

Black line: AT40 (T2108) (% measured on the right)
Red line: Overbought threshold (70%); Blue line: Oversold threshold (20%)
Weekly AT40 (T2108)

*All charts created using freestockcharts.com unless otherwise stated
The T2108 charts above are my LATEST updates independent of the date of this given AT40 post. For my latest AT40 post click here.
Be careful out there!
*Charting notes: FreeStockCharts.com stock prices are not adjusted for dividends. TradingView.com charts for currencies use Tokyo time as the start of the forex trading day. FreeStockCharts.com currency charts are based on Eastern U.S. time to define the trading day.
Disclosure: Long QQQ calls, long AUD/JPY, long UVXY puts, long GM calls, long INTC calls, long USO calls, long WYNN calendar call spread, long GLD, long BIDU call, short TSLA call spread, long TSLA ...
more

