
Revenue Growth Drives Shareholder Returns
The market works in long term cycles even though it seems like changes occur often. There will always be news which drives short term action, but in the long run there are strategies which last for years or even decades. In the past 11 years, growth stocks have outperformed value stocks. It’s easy to ignore short term cyclical noise, but it’s not easy to have conviction in long term secular market dynamics, especially when it negatively affects your returns.
If an analytical process works for an investor, he/she will continue to ride the wave. The wave gets bigger as more capital follows it. A strategy which gave some investors their career success will not be abandoned quickly. Standing in front the wave simply doesn’t work if it lasts for years. The difference between stubbornness and discipline is a fine line; ultimately you need to ask yourself if your logic is wrong if it hasn’t been working for years.
Sales Growth Drives Returns
We explained why long trends in thinking stay in play. They snowball as capital follows what is working. Therefore, you need to deeply examine what is working to understand how to profit off the wave. One major trend is the importance of sales growth. In this cycle, growth stocks have outperformed value stocks which has left value investors with losses or has caused them to alter their strategy. Interestingly, revenue growth had been an important valuation metric even before this cycle.
As you can see from the Morgan Stanley chart below, from 1990 to 2009,revenue growth was the biggest driver of long term shareholder returns.
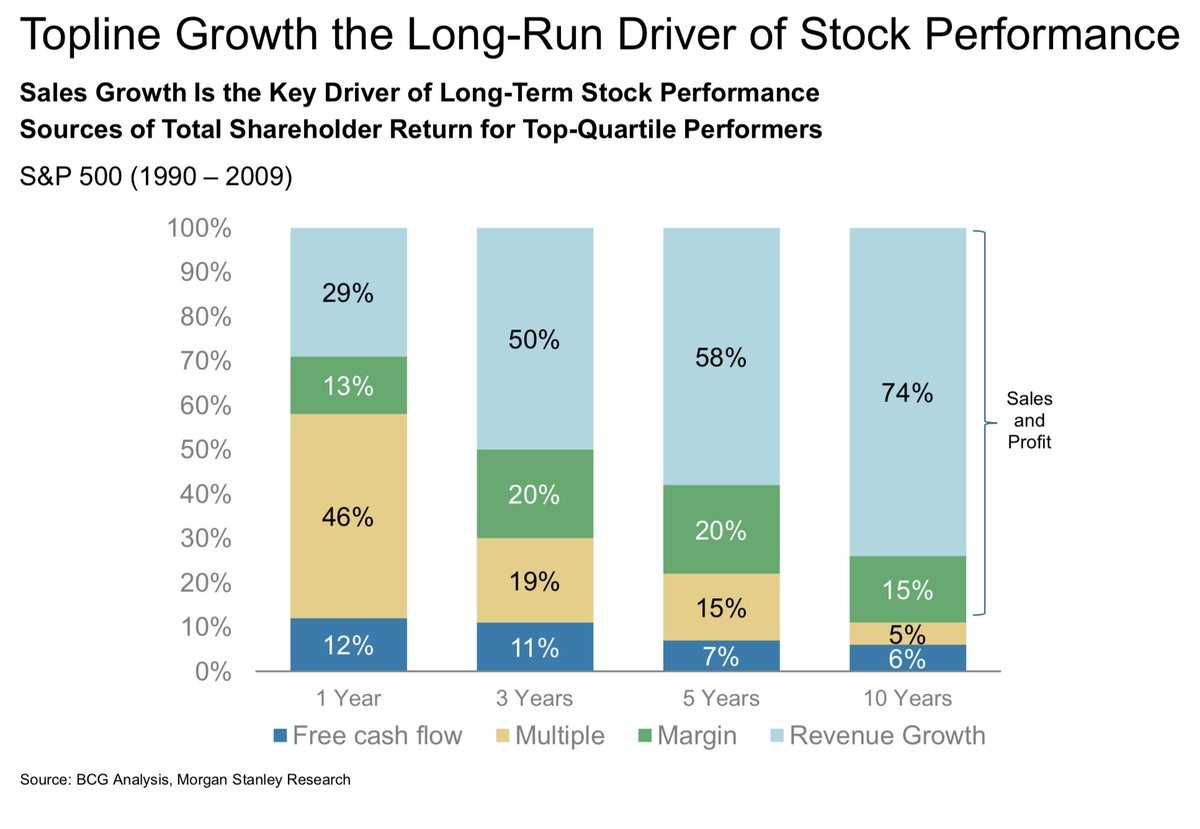
Source: Morgan Stanley
The other aspects listed are free cash flow, stock multiples, and changes to margins. Discounted free cash flow models are a great way to understand how a firm operates and which operations of the business are important. However, predicting sales growth has been more fruitful to realizing returns over the long term.
Latest Sales Results From Q2
With 454 S&P 500 firms reporting second quarter earnings results, 80% of firms have beaten their EPS estimates for 26.4% growth and 74% of firms have beaten their sales estimates with 10.9% earnings growth. Generally, sales growth results beat less often as they are harder to game.
The Earnings Scout chart below shows the earnings growth in the past 3 years at the point when 452 firms reported earnings.
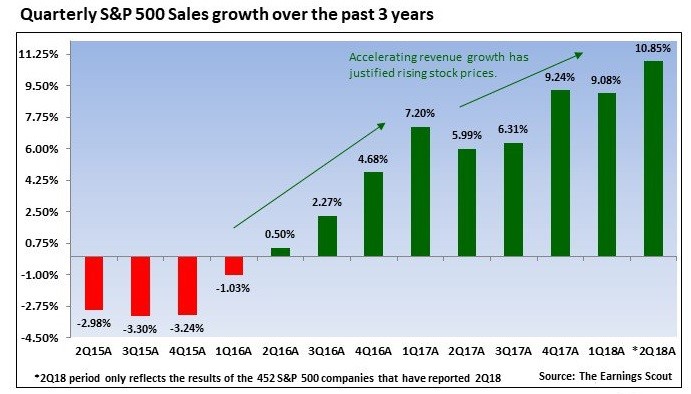
Source: The Earnings Scout
The sales growth rate has accelerated ever since the economic weakness from the second half of 2015 to the first half of 2016 subsided. The weakness was somewhere in between a recession and a mid-cycle slowdown. These poor results allowed growth rates to rebound since there were easy comparisons.
Sales growth is a more important measure of growth in 2018 because profit growth is amplified by the tax cuts. The strong sales growth rate shows that the economy and corporate profits would be healthy without the tax cut. The tax cut amplified the cyclical recovery. It’s weird to think of 2017 and 2018 as recovery years because this business cycle is so prolonged. This is a great example of how the economy doesn’t have just two modes (expansion and recession); it can also be in a slowdown or a recovery in the midst of an expansion.
Ways To Measure Sales Growth
It’s interesting that as sales growth has become the most important metric to review, the price to sales ratio has risen to record highs. The chart below shows the median S&P 500 price to sales ratio is at a record high and the market cap weighted price to sales ratio is near where it was at the cycle peak in 2000.
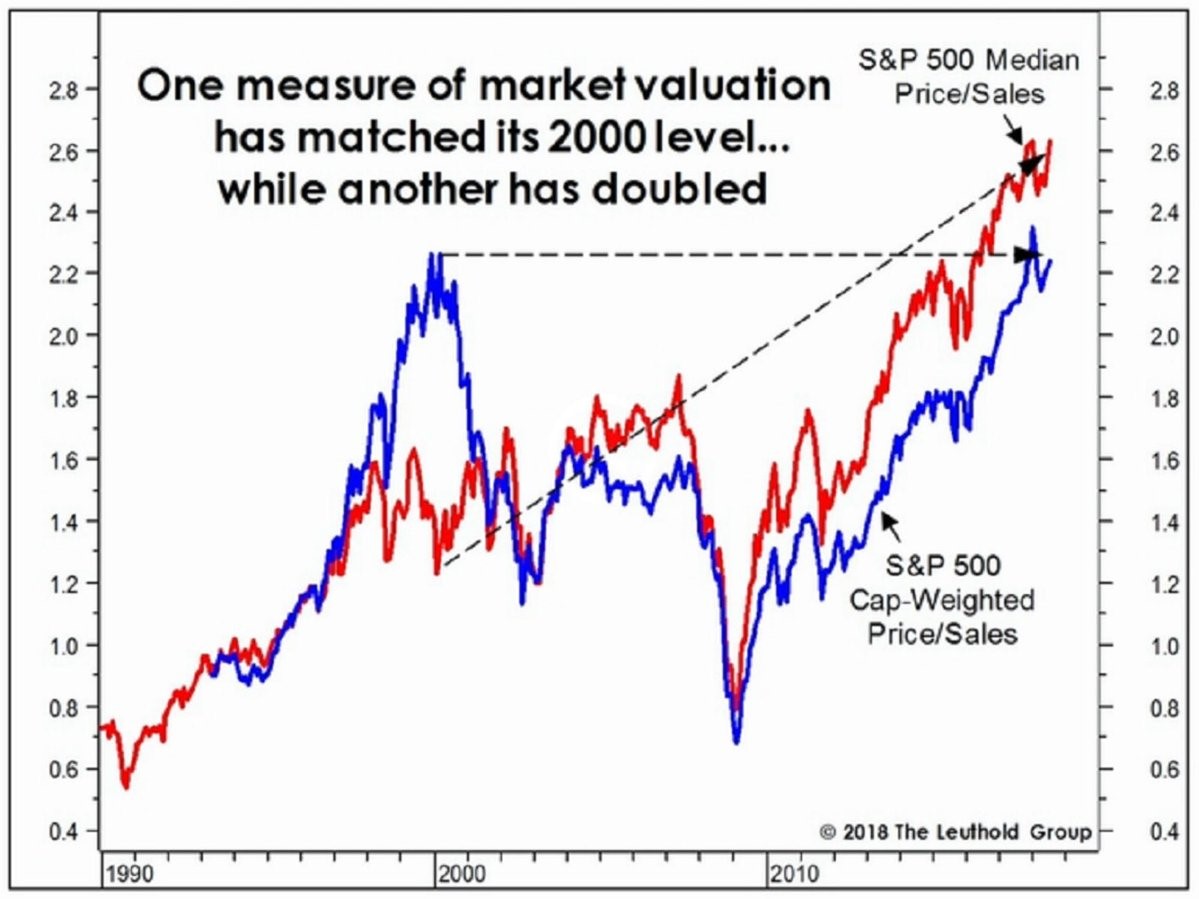
Source: The Leuthold Group
The best explanation for why sales multiples are high is that profit margins are high. If each dollar in sales delivers more profits, the sales are worth more to investors. It’s incorrect to say this will mean revert, for the sake of mean reversion itself. Profit margins are cyclical. The question is if margins are also in a secular trend higher. New companies especially in software have been able to maintain high margins. It’s difficult to use historical precedence to explain why competition will cut into profit margins because the world has changed so vastly in the past few decades. The wave is strong and doesn’t appear to be impacted by high sales multiples.
Besides measuring price to sales, you can measure enterprise value to sales. The enterprise value includes the debt and subtracts the cash. Adjusting for the cash and debt at hand gives you a more specific valuation of just the business. Another valuation metric is enterprise value to EBITDA. This looks at earnings before interest, taxes, depreciation, and amortization. It can be easily summarized as ‘earnings before the bad stuff.’ The problem with this metric is it can be gamed to support valuations. Through accounting tricks normal expenses can be included in the depreciation and amortization categories to make results look better. As you can see from the Raymond James chart below, the EV to EBITDA multiple is above the normal standard deviation and is approaching the heights seen in the late 1990s.
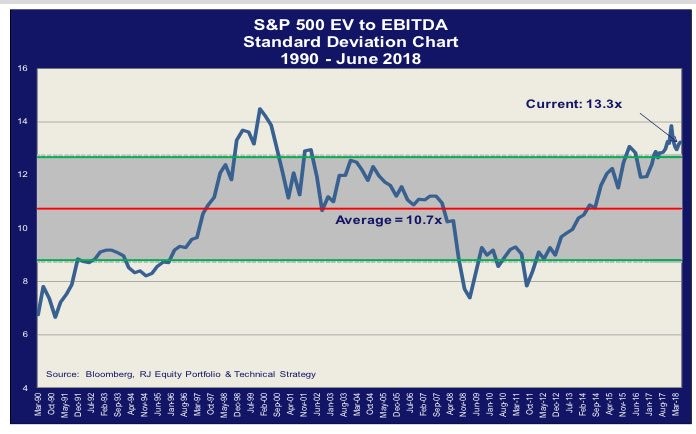
Source: Raymond James
Adjusting Valuation Metrics
Adjusting valuation metrics can be dangerous and fruitful. Equity valuation isn’t always as straightforward as using old metrics to interpret new trends. Sometimes to follow a new trend, you need to adjust. The potential problem is you can adjust for anything to fit a narrative. You can decide any change is structural even if it isn’t.
The chart below tries to adjust valuations for low interest rates, claiming that we are in a new normal of low rates.
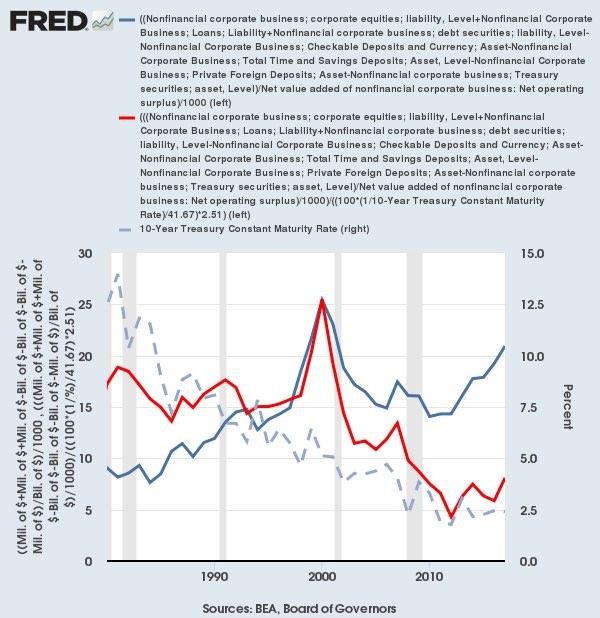
Source: FRED
There is certainly a point to this since strong economic growth and heightened inflation in 2018 couldn’t even give us a 10 year U.S. treasury yield above 3% for more than a few days. The chart above adjusts EV/EBIT for the new normal of low interest rates using the peak of the 2000 market as a basis. The lower rates are the dotted line, the blue line is actual results, and the red line is the adjustment. Unsurprisingly, the metric shows stocks are cheap.
Conclusion
We aim to present and fully explain various theses as to why stocks should go up or down. We think just looking at the same old analytical points won’t give you an edge. We aren’t advocating one thesis over any other one as long as the arguments for both remain valid. Our only purpose is to provide objective insight and to obtain various valid perspectives of what the truth is.
Disclaimer: Please familiarize yourself with our full disclaimer here.


